Results Snapshot
Incoming inspection, in-process issues, customer complaints, nonconformance, CAPA, and supplier corrective action workflows went live within 7–9 weeks
Issue classification, ownership assignment, and initial disposition time decreased by 32%
Average CAPA closure cycle time decreased by 35%, with corrective actions, owners, due dates, and verification results managed in one workflow
Selected high-frequency recurring defects decreased by 18% within 12–16 weeks after go-live
Customer complaint response preparation time decreased by 30%, while audit evidence preparation time decreased by 45%
Quality leaders gained a clearer view of quality cost drivers by product, process, supplier, defect type, and rework cause
The Anodized Bracket Did Not Stop at Rework
The customer is a UK aerospace precision components supplier. Its products include aluminum mounting brackets, sensor housings, actuator connectors, lightweight structural parts, small assemblies, and related fastening components. The company serves aerospace system integrators, cabin equipment suppliers, and precision engineering customers, with processes covering CNC machining, deburring, surface treatment, cleaning, dimensional inspection, visual inspection, lot packaging, and customer delivery.
Before the project, one lot of aluminum mounting brackets was flagged during customer incoming inspection for uneven anodized finish, with light burrs around several slot edges. The internal review showed that the two issues did not come from one process. Surface treatment came from an external supplier lot, the slot burrs appeared related to tool wear on one machine, and final inspection had not connected both findings into one quality risk event.
The team completed containment, rework, and customer response, but the real effort was rebuilding the evidence chain from inspection records, supplier lot data, machining parameters, rework records, and email threads. The event changed how leadership defined closure. Finishing rework meant the defect had been handled; it did not prove root cause, recurrence prevention, or effectiveness.

Rework Did Not Mean Risk Was Closed
The customer already had quality records. Incoming inspection captured surface treatment abnormalities, in-process inspection recorded dimensional deviations, final inspection identified burrs or cleanliness issues, and customer complaints described assembly interference, appearance concerns, or marking errors. The issue was that these records often stayed inside their own process steps, making it difficult to see whether different findings shared the same supplier lot, tooling condition, fixture condition, or packaging risk.
In aerospace precision manufacturing, recurring defects carry more risk than isolated events. One burr rework can be solved through manual finishing, but if similar burrs appear across multiple lots, the customer sees a process control issue rather than a one-time defect. One surface treatment abnormality can be corrected by a supplier, but without internal verification, the supplier issue can return in another form.
QMS therefore needed to keep the issue moving. Temporary containment, initial disposition, root cause analysis, corrective action, supplier response, effectiveness verification, and recurrence monitoring had to connect. Only when later lots confirmed that the problem was controlled could the event move from handled to verified.
The Lot Connected the Story
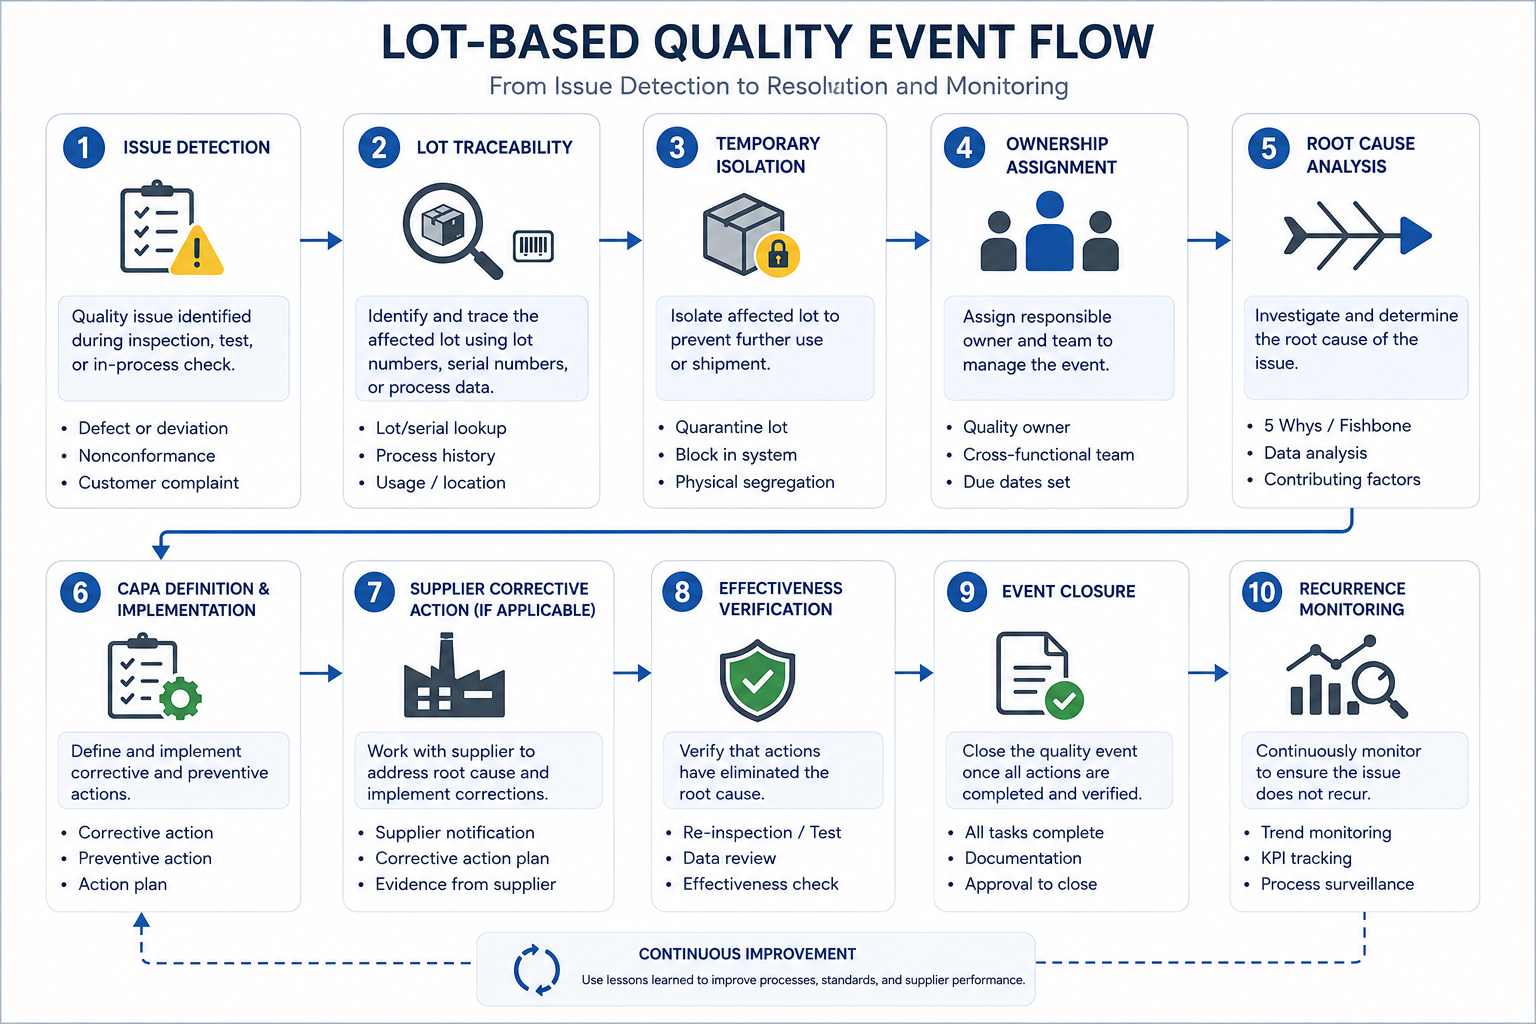
Industry Software and the customer team first designed quality events around lot-based traceability. When an issue was detected, the system captured source, product, lot, supplier, process, defect category, severity, and impact scope. From there, the issue moved through containment, disposition, ownership assignment, root cause analysis, CAPA, supplier corrective action, effectiveness verification, and recurrence monitoring.
This made quality teams look beyond an isolated defect. A slot burr could be connected to a machining work order, machine, tool check record, and rework activity. An anodizing abnormality could be connected to supplier lot, incoming inspection, affected inventory, and customer shipment scope. A customer complaint could be traced back to product lot, inspection record, and completed corrective actions.
This made quality teams look beyond an isolated defect. A slot burr could be connected to a machining work order, machine, tool check record, and rework activity. An anodizing abnormality could be connected to supplier lot, incoming inspection, affected inventory, and customer shipment scope. A customer complaint could be traced back to product lot, inspection record, and completed corrective actions.
Burr, Edge Condition, and Assembly Interference Needed One Language
Early in the project, the customer found a basic issue: the same defect had different names across teams. Production might write “burr,” final inspection might record “edge condition,” customer feedback might describe “assembly interference,” and supplier feedback might refer to a “handling mark.” These terms were understandable in conversation, but in reports they became different categories and distorted trend analysis.
Industry Software helped the customer rebuild defect language. The system standardized categories such as dimensional deviation, burr or sharp edge, surface treatment abnormality, cleanliness issue, hole-position deviation, marking error, packaging damage, material abnormality, supplier lot issue, and customer assembly feedback. Each category could connect with source, severity, affected process, responsible team, and disposition method, while case-specific notes remained available for detail.
With one defect language, quality meetings became more focused. Teams no longer began by debating whether burr and edge condition referred to the same issue. They could go directly to where the defect appeared, which product or process repeated it, who owned the action, and what customer impact it created. Leadership also gained a clearer view of which defects were driving rework, reinspection, and complaint cost.
CAPA Needed Evidence, Not Confirmation Emails
The challenge in CAPA was not writing corrective actions. It was proving that the actions worked. Previously, corrective actions could sit in meeting notes, emails, or personal task lists, forcing quality managers to follow up repeatedly with production, engineering, purchasing, and supplier teams. Even when an action was completed, it was difficult to prove whether later lots were stable, customers had stopped reporting the issue, or the defect trend had declined.
In QMS, CAPA was broken into executable actions. The system recorded temporary containment, root cause analysis, corrective actions, preventive actions, owners, due dates, completion evidence, and verification results. Production could own fixture checks and deburring adjustments, engineering could review tool wear and machining parameters, purchasing could drive surface treatment supplier response, and quality could verify follow-up lot inspection, dimensional trends, visual review, and customer feedback.
Verification became a closure condition rather than a document added later. The customer could confirm effectiveness through follow-up lot inspection, dimensional trends, visual reinspection, customer feedback, or recurrence monitoring. The system made the difference between rework completed, action completed, and risk reduced much clearer.
Supplier Lots Joined Root Cause Analysis
Some quality issues did not come entirely from internal processes. Aluminum material condition, surface treatment quality, outsourced cleaning, packaging methods, and supplier lot variation could all affect final product quality. If supplier corrective actions stayed in email, quality teams could not easily connect external causes with internal inspection records, purchase lots, production impact, and customer responses.
Industry Software connected supplier corrective actions with QMS workflows. When incoming inspection or production identified a supplier-related issue, the system linked supplier, purchase lot, item number, inspection record, nonconforming quantity, and disposition method. For issues requiring supplier response, the system generated supplier corrective action tasks and recorded cause statements, improvement actions, target dates, and internal verification results.
This gave purchasing and quality teams a stronger basis for supplier evaluation. Management could review trends by supplier, item category, defect type, lot, and repeated issue. Supplier discussions could move beyond price and delivery into specific quality performance and corrective action discipline.
Customer Responses Were No Longer Evidence Hunts
Aerospace component customers often expect suppliers to explain issue source, impact scope, containment actions, and recurrence prevention quickly. After a complaint, quality teams need inspection records, lot information, production work orders, supplier documents, root cause analysis, and verification evidence. Previously, these materials lived in spreadsheets, emails, inspection equipment records, and meeting notes, so customer response preparation became a last-minute evidence hunt.
After QMS go-live, customer complaints could connect directly with products, lots, inspection results, nonconformance disposition, CAPA, supplier corrective actions, and verification records. Quality engineers no longer had to assemble evidence from several folders at the last minute. For customer responses, internal audits, or customer audit preparation, traceability became clearer and evidence preparation effort decreased.
The quality of customer responses also became more consistent. Teams could explain when an issue was found, which lots were affected, what containment actions were taken, what root cause was identified, which corrective actions were completed, and how effectiveness would be verified. The system strengthened not only evidence preparation, but also customer confidence in the supplier’s quality discipline.
Three Defect Streams Entered Strict Closure First
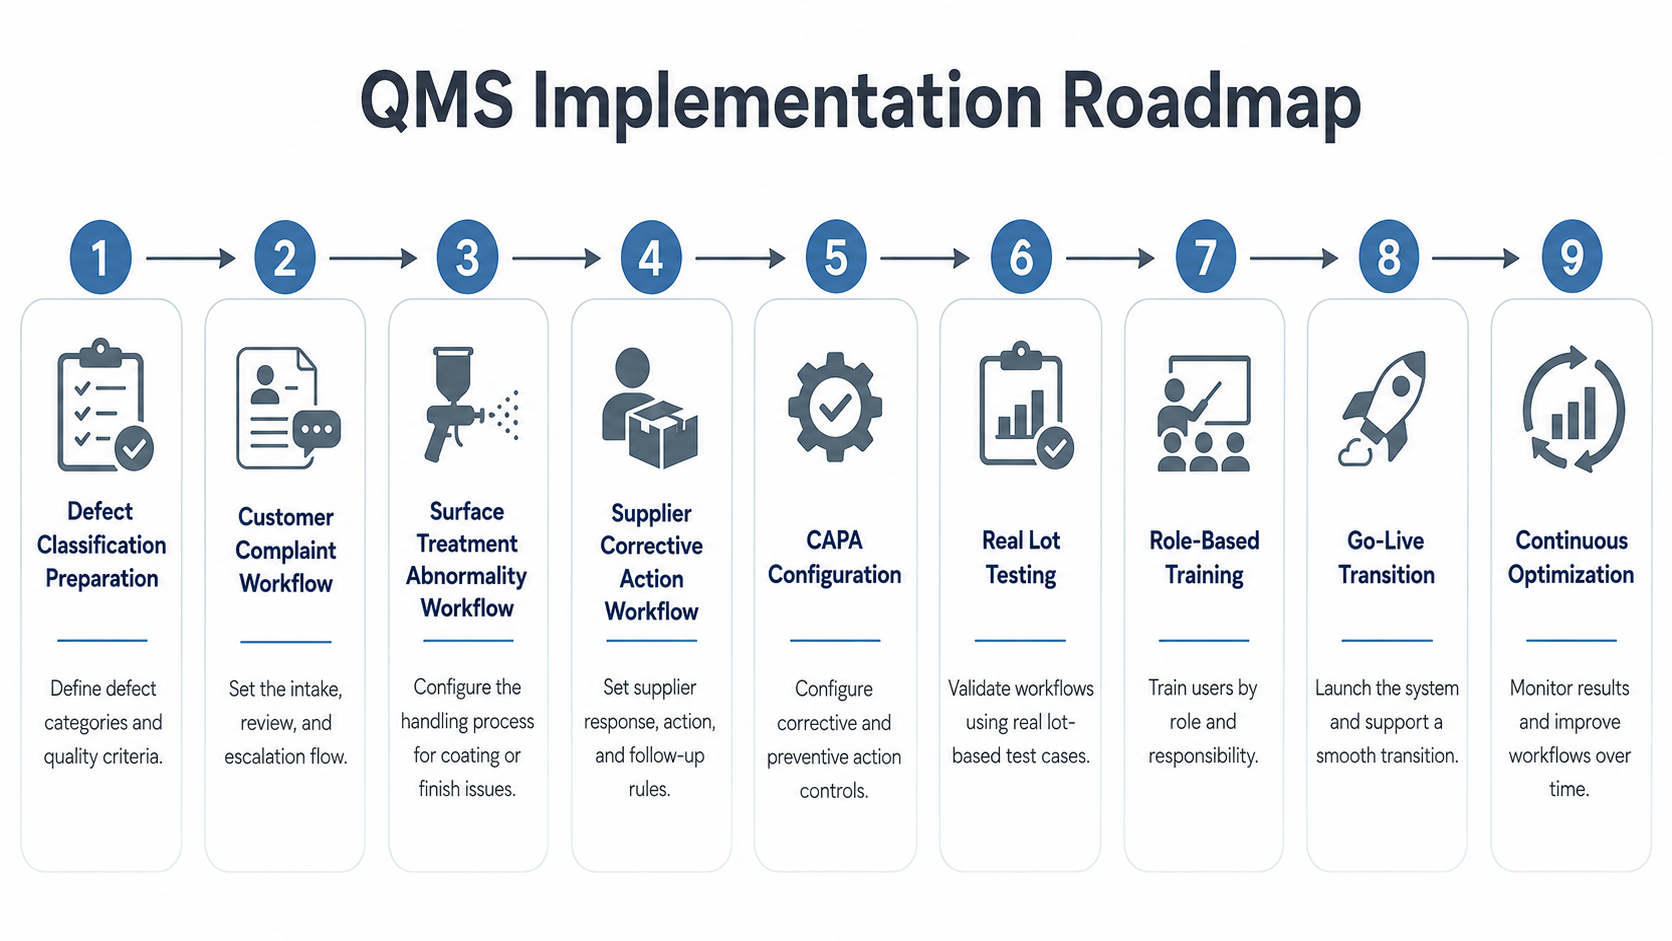
Implementation did not begin with every quality process at once. Industry Software and the customer selected three defect streams most likely to affect customer confidence and delivery rhythm: customer complaints, surface treatment abnormalities, and repeated dimensional or burr issues. These streams covered external customer pressure, supplier lot risk, and internal process stability, making them the strongest test of closed-loop QMS value.
Historical data was handled selectively. Major customer complaints, key supplier quality issues, and high-frequency defect records were retained for initial classification and trend analysis. Low-frequency historical problems stayed in basic records and could be enriched later if needed. This prevented old documentation from slowing the project while letting QMS support current quality management quickly.
Workflow configuration was tested against real abnormalities. The project team used uneven anodizing, slot burrs, hole-position deviation, incoming dimensional issues, customer returns, and recurring defects to validate system logic. These scenarios helped the customer clarify defect categories, CAPA triggers, supplier correction ownership, and effectiveness verification methods before go-live.
Shop Floor Entry Had to Stay Light
QMS adoption depended on whether shop floor users could work with it. Inspectors needed to record issues quickly, production supervisors needed to receive containment and rework tasks promptly, engineering teams needed to add root cause analysis, and purchasing or supplier management users needed to track external corrective actions. If the system was too heavy, users would return to spreadsheets and messages; if it was too light, quality teams would lose the structure needed for analysis.
Industry Software split actions by role during implementation. Inspectors learned how to record abnormalities, upload photos, select defect categories, and start nonconformance disposition. Production supervisors learned how to receive issues, execute isolation, and provide corrective feedback. Engineering teams focused on root cause analysis and process adjustment, while purchasing and supplier management teams handled supplier corrective actions and incoming quality trends.
After go-live, fields and dashboards continued to be refined based on user feedback. High-frequency minor issues received a simplified entry path, while customer complaints and recurring defects kept stricter CAPA and verification requirements. Quality no longer had to chase every issue alone; production, engineering, purchasing, and supplier management became part of the closed-loop responsibility chain.
Reviews Started Showing Repeat Patterns
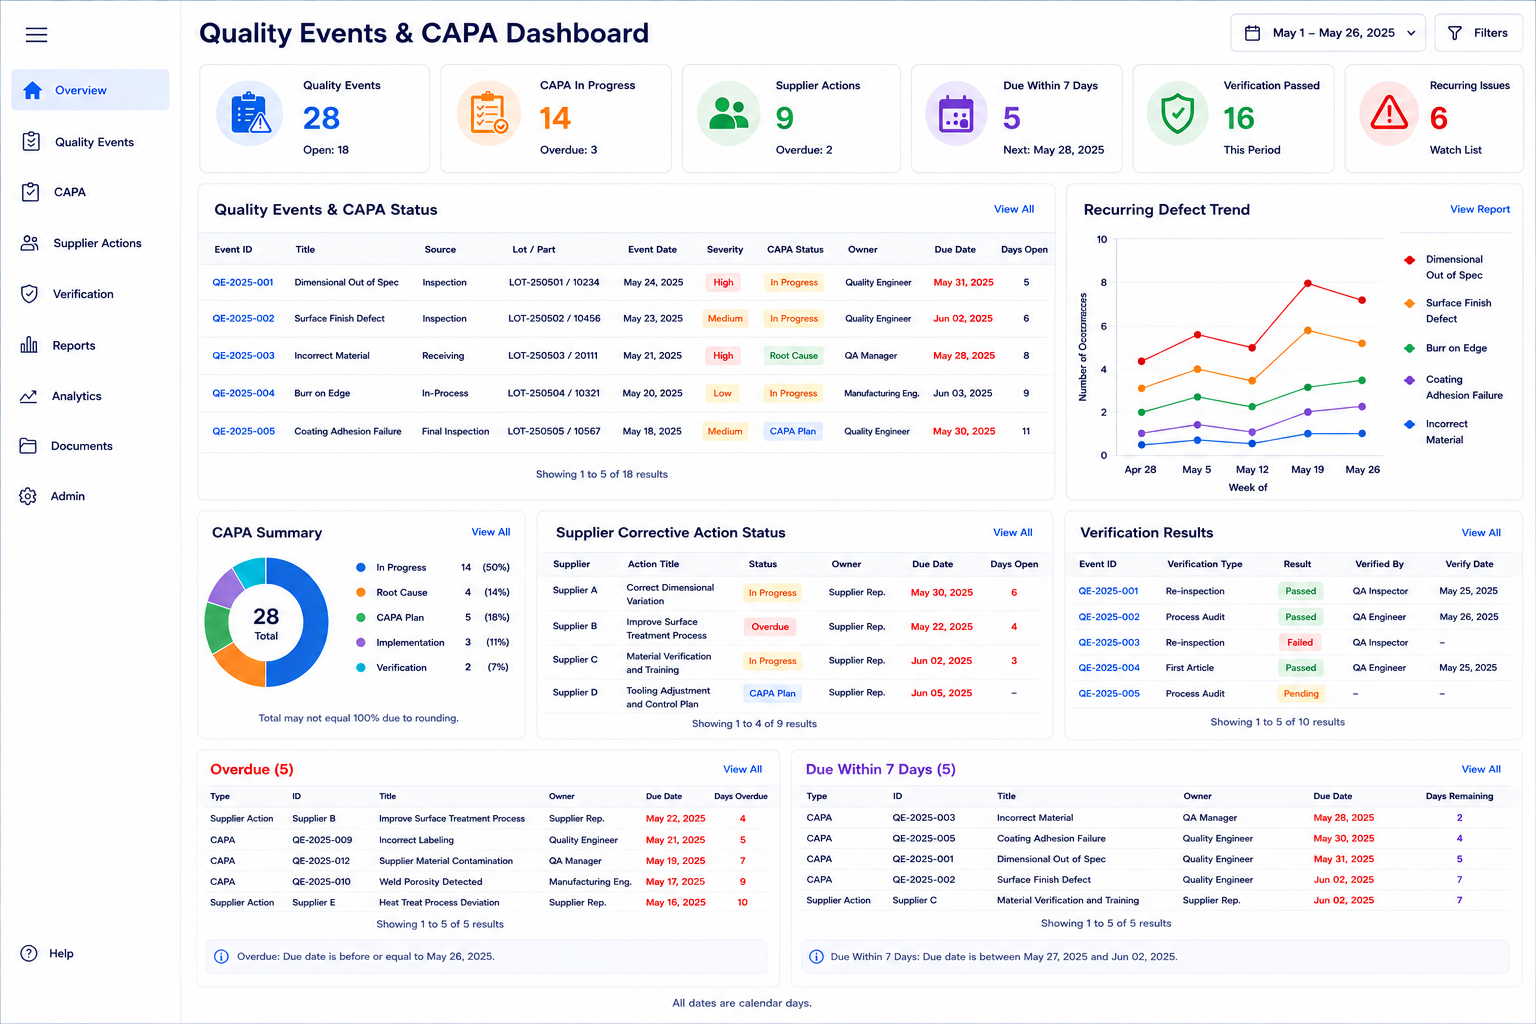
Core workflows went live within 7–9 weeks. An operational review conducted 8–12 weeks after go-live showed that issue classification, ownership assignment, and initial disposition time decreased by 32%. Quality teams could identify issue source, defect type, impact scope, and responsible owners faster, while production and engineering teams received action items more promptly.
Average CAPA closure cycle time decreased by 35%. Root cause analysis, corrective actions, owners, due dates, and verification results were managed in one flow, reducing the need for manual follow-up. Leadership could view overdue tasks, pending verification actions, and recurring defects directly, helping them judge whether improvements were truly moving.
Selected high-frequency recurring defects decreased by 18% within 12–16 weeks after go-live. These improvements came from more consistent defect classification, faster containment, clearer ownership, and verification rather than one-time rework. The customer could identify repeated problems earlier and drive changes to process parameters, tooling maintenance, supplier requirements, cleaning workflows, or packaging methods.
Customer complaint response preparation time decreased by 30%. Quality teams could retrieve related lots, inspection records, disposition actions, root cause analysis, corrective actions, and verification evidence faster. Audit evidence preparation time also decreased by 45%, allowing quality users to spend more time on improvement and less time assembling records.
Quality Cost Had a Source
The long-term value of QMS goes beyond faster issue closure. For an aerospace precision components supplier, burr rework, dimensional reinspection, surface treatment rework, supplier lot abnormalities, and customer returns all create quality cost. By connecting defect type, product lot, process, supplier, corrective action, and verification result, the system gave management a clearer view of where that cost originated.
Financial impact becomes clearer as quality data matures. With recurring defects reduced by 18%–24%, the customer can further analyze rework labor, scrap material, additional inspection, customer return handling, and expedited replacement cost. Shorter CAPA cycles and faster complaint response preparation also reduce hidden time costs for quality engineers who previously spent hours tracking, organizing, and communicating issue status.
Industry Software helped the customer build more than a quality form repository. It created a closed-loop system from issue detection to verified corrective action. Quality events gained lots, owners, evidence, and verification, while leadership gained a clearer view of repeated problems and improvement priorities. For aerospace component suppliers, quality competitiveness comes from consistent execution discipline, and QMS moves each issue into an assignable, verifiable, reviewable, and continuously improving workflow.
Client Quote
“The anodized bracket lot made us realize that finishing rework did not mean the issue was truly closed. When the customer asked about cause, impact scope, and recurrence prevention, we had to pull evidence from inspection records, supplier lots, process parameters, and emails. Now each quality event shows lot, process, owner, CAPA, and verification results, so we respond faster to customers and have stronger evidence for internal review.”