Facility Monitoring Software for Site KPIs, Alerts, and WIP Visibility

Summary
×Facility Monitoring Should Move from Visibility to Response
Facility issues rarely appear as one isolated metric. A machine stoppage can affect WIP progress, labor allocation, material usage, delivery dates, and cost performance at the same time. An operator absence can push a shift, a machine, or a work order into delay. When these signals live in separate production reports, maps, messages, and field logs, managers may see the outcome but struggle to understand where the issue happened, what it affects, and who should respond. Facility Monitor creates value when an issue can move from detection into location, ownership, response, and review.
This requires a clear facility monitoring model. The model is not a map alone, and it is not a KPI table alone. It combines five elements:
Site structure: Defines the monitoring scope, including the relationships between sites, zones, assets, employees, and WIP.
KPI logic: Defines which metrics represent normal performance and which changes indicate operational risk.
Exception rules: Defines when alerts should trigger, such as downtime, operator absence, calibration due, or material delay.
Role permissions: Defines who can view information and who is responsible for confirming, assigning, and resolving issues.
Response workflow: Defines how an issue is located, communicated, documented, followed up, and reviewed.
When these five elements are clear, Facility Monitor becomes more than a visibility tool; it becomes an operational response center. Without this structure, a system may show maps, KPIs, and alerts, but teams may still be unsure which signals require action or who should respond. Industry Software can configure facility monitoring rules around this model so site data becomes part of daily operating decisions.
For multi-site operations, manufacturing plants, warehouses, and field service teams, facility monitoring should not only answer “what is the current site status.” It also needs to answer which area has an issue, which resource is affected, which tasks may be delayed, whether the cause is labor, equipment, material, quality, or environment, and whether the response has been recorded. Industry Software’s Facility Monitor can be configured around this model so executives, supervisors, maintenance, quality, planning, and production teams work from the same operating facts. Teams do not only see site conditions; they see signals that can lead directly to action.
Site Metrics Need to Become Operating Signals
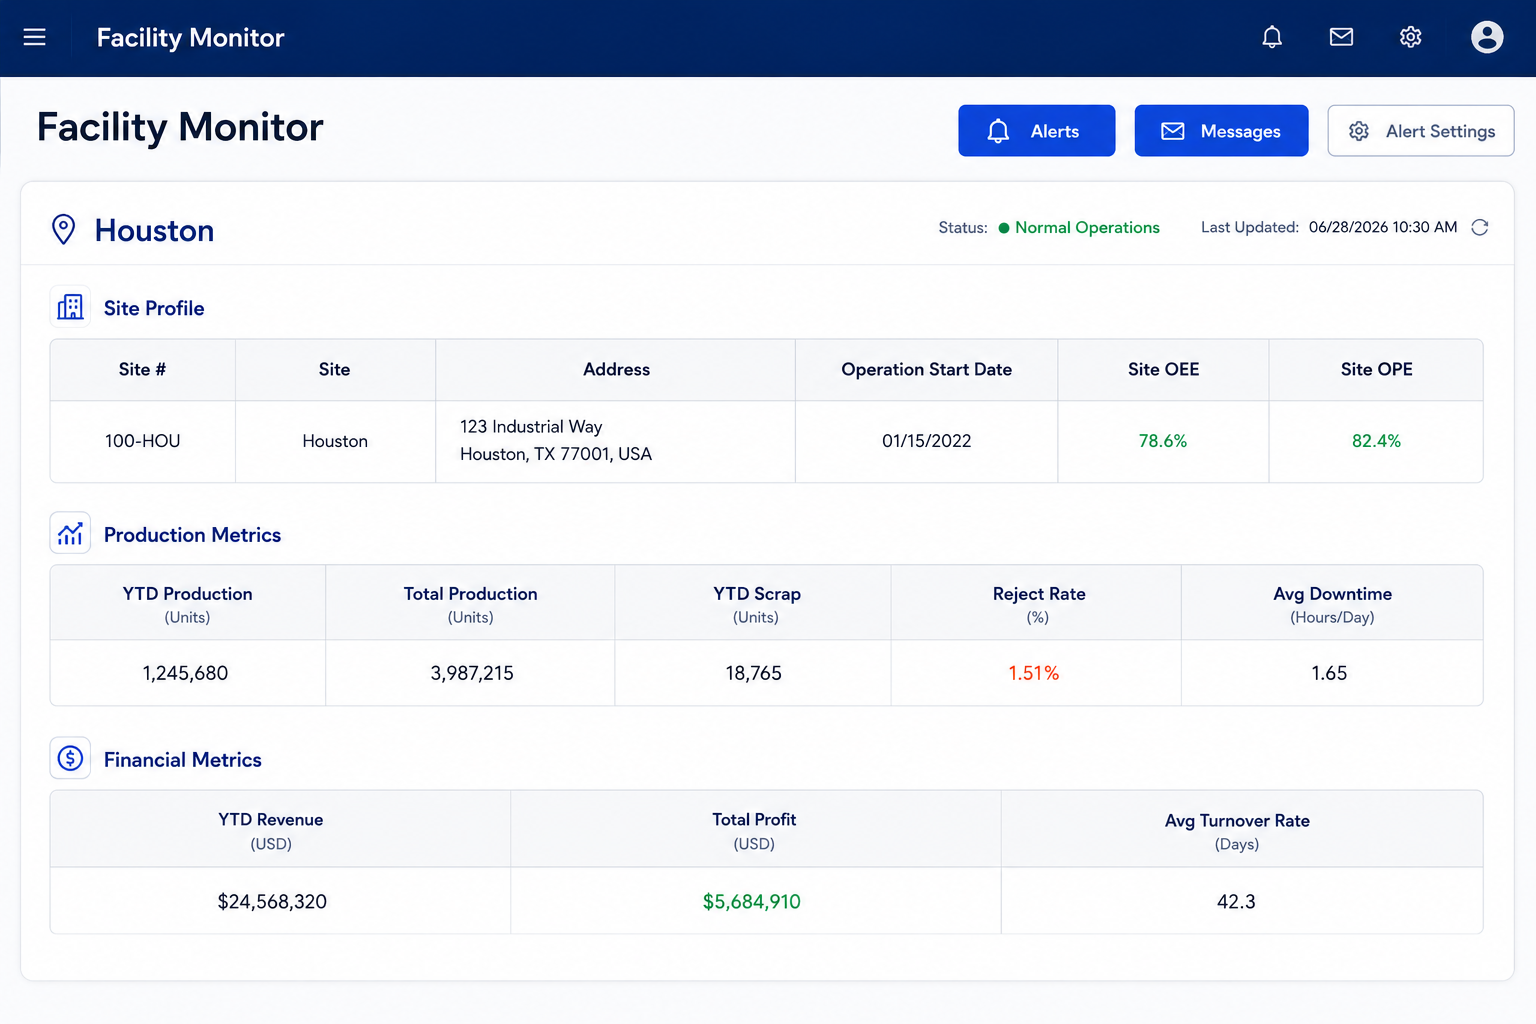
OEE, OPE, production volume, scrap, downtime, cycle time, revenue, COGS, and profit margin should not exist only as reporting numbers. They should act as early operating signals that help managers understand whether efficiency is falling, quality loss is growing, cost pressure is increasing, or margin movement is linked to execution. Rising scrap may increase COGS, longer downtime may reduce available capacity, and cycle time changes may point to a process bottleneck. When production and financial metrics are viewed together at the site level, managers can better understand the reasons behind performance shifts.
The value of site KPIs is to show teams where to drill down. If OEE drops, the next question may involve resources, employees, WIP, or downtime logs. If margin declines, managers may need to review scrap, equipment cost, labor cost, or production rhythm. Industry Software brings these indicators into Facility Monitor so KPIs can become entry points for action. When a metric shows risk, teams can decide whether to trigger an alert, schedule maintenance, adjust shifts, or review the production plan.
Site KPIs can help teams monitor:
Whether facility efficiency is below expectations
Whether production, scrap, or downtime is changing abnormally
Whether cost and revenue remain aligned
Whether margin movement is linked to execution issues
Which metrics should trigger alerts or review
A Map Becomes Useful When It Locates Risk
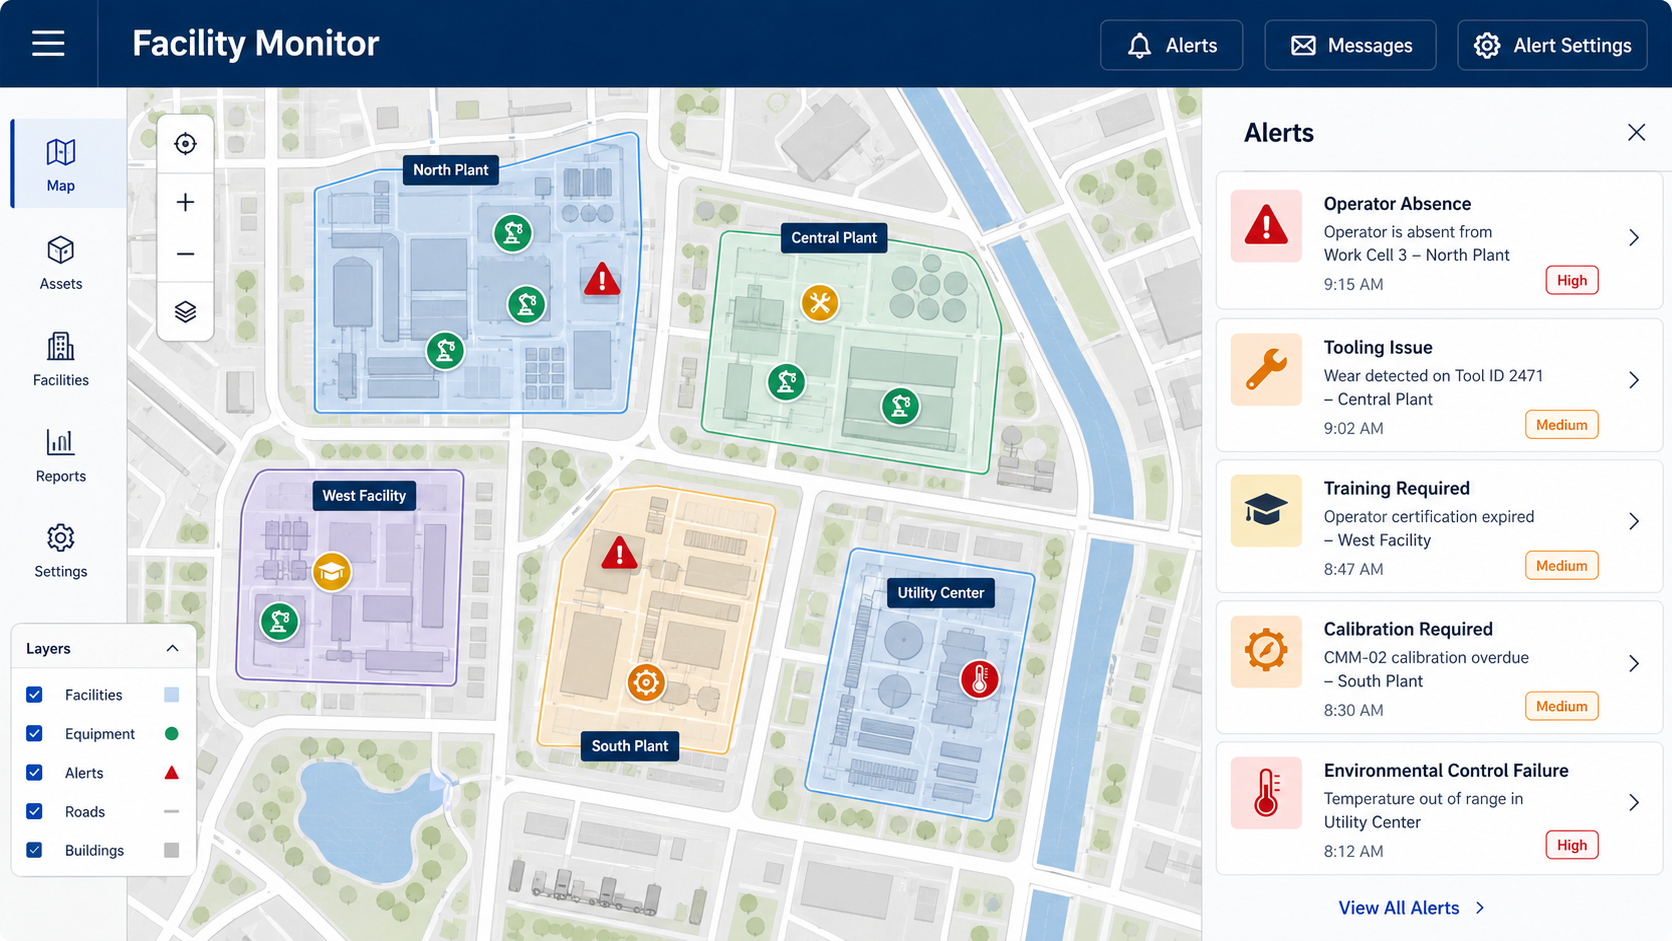
The real value of a map view is not showing where a site is located. It is showing where risk is happening inside the operating environment. An HVAC failure may affect temperature and equipment stability in one zone, a tooling issue may be concentrated near a machine, and an operator absence may affect a shift or resource group. Text alerts can tell supervisors what happened, but map context helps them understand where it happened and what else may be nearby. For larger facilities or distributed sites, location-based visibility can reduce response time.
When the map and alert panel work together, an issue is no longer an isolated event. Different alerts can be tied to facility areas, asset points, or resource locations so supervisors can understand risk scope and response priority:
Operator Absence: Locates the affected shift, resource group, or work area and helps determine whether labor needs to be reassigned.
Tooling Issue: Locates the related machine or workstation and helps assess whether current WIP or downstream operations are affected.
Training Required: Identifies the affected asset, role, or operator group and helps determine whether task assignment should be limited.
Calibration Required: Locates inspection equipment or quality-related resources and helps assess impact on test accuracy and quality records.
Environmental Control Failure: Locates temperature, humidity, or facility environment issues and helps determine impact on production stability or safety requirements.
Supervisors can review the risk location first, then use alert details to involve maintenance, quality, training, production, or planning teams. Industry Software turns the map from a display layer into a response tool that supports location, assignment, and follow-up.
Alerts Need Owners, Not Just Visibility
Alerts create value only when they lead to ownership and action. An operator absence may require task reassignment, a worn tool may require replacement, a training gap may delay new equipment use, and calibration due dates may affect quality accuracy. If alerts remain simple notifications, teams still need phone calls, emails, or chat messages to decide who should respond. Facility Monitor should make alerts part of an operational response path.
Messages and Alert Settings help govern that response. Equipment alerts may go to maintenance, labor issues to supervisors, calibration or quality alerts to QA or engineering, and environmental issues to facilities or safety leaders. Rules can be configured by alert type, threshold, site, resource, or recipient role. Clear alert governance reduces noise and makes sure important issues are not missed.
Downtime Analysis Should Move from Hours to Causes
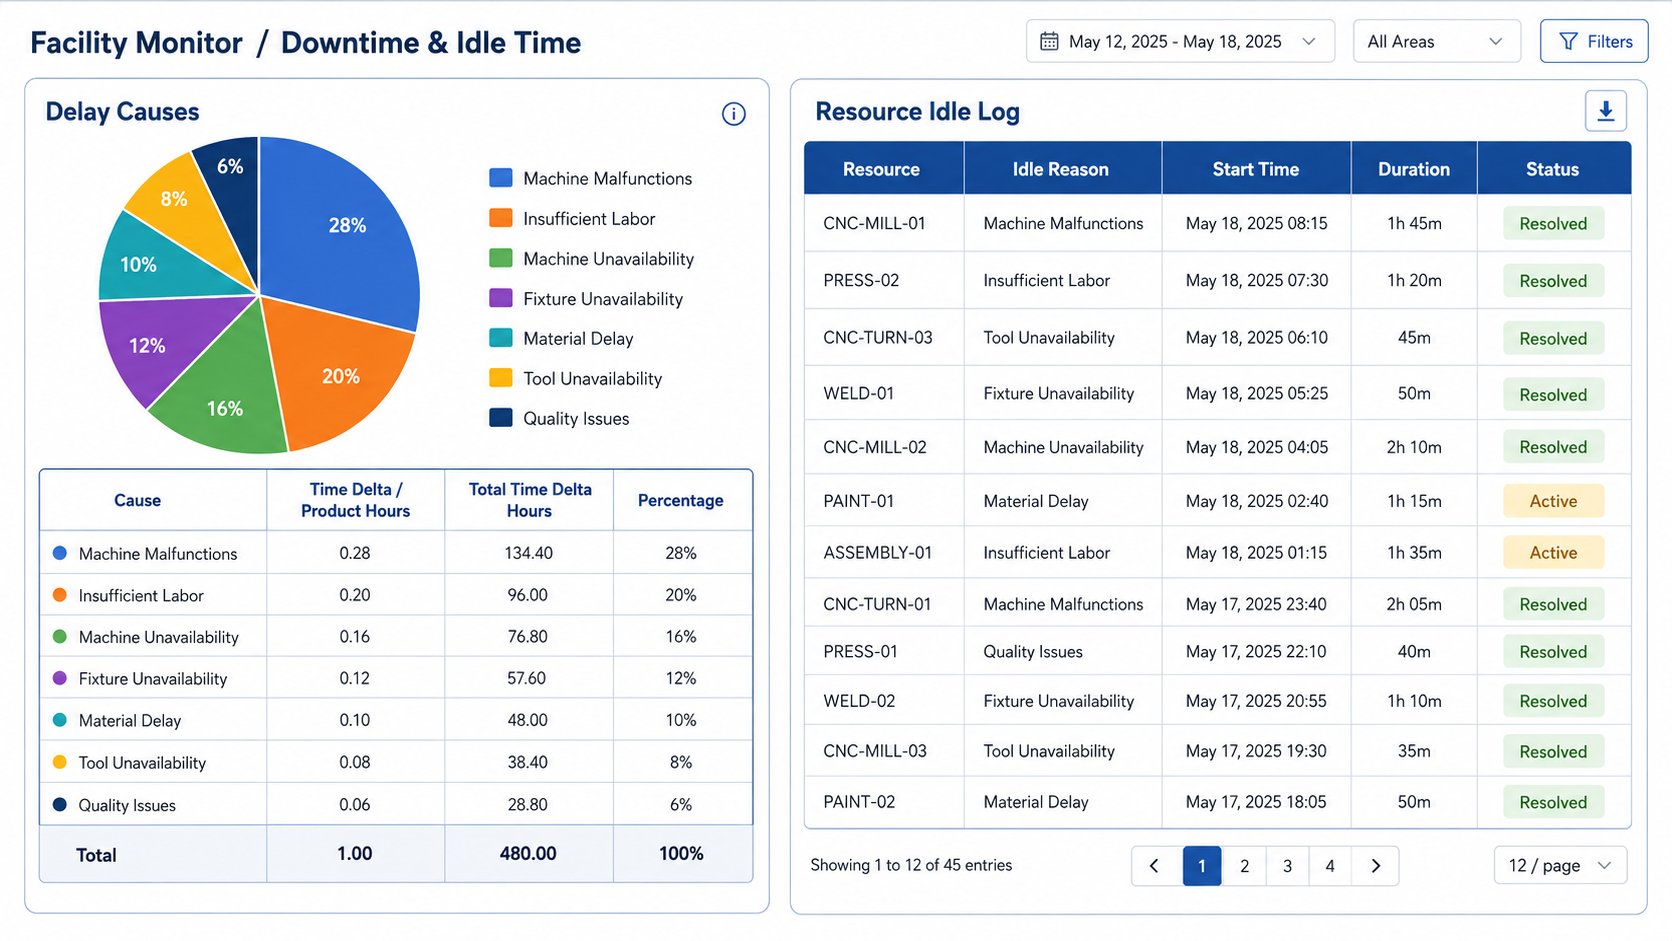
Downtime hours are only the outcome. The cause determines what can be improved. Delay Causes and Resource Idle Log can structure issues such as Machine Malfunctions, Insufficient Labor, Machine Unavailability, Fixture Unavailability, Material Delay, Tool Unavailability, and Quality Issues. This helps teams understand which causes consume the most time and whether they are recurring. Without standardized cause categories, downtime review can remain subjective and difficult to act on.
Once causes are structured, improvement becomes more focused. High machine malfunction may require maintenance planning or spare parts review, insufficient labor may point to scheduling or cross-training, fixture unavailability may reveal preparation gaps, and recurring quality issues may require process review. Industry Software places delay causes and idle logs inside the facility monitoring environment so teams can move from detecting downtime to reducing it. This has direct impact on capacity, cost, and delivery stability.
WIP Turns Site Risk into Job-Level Action
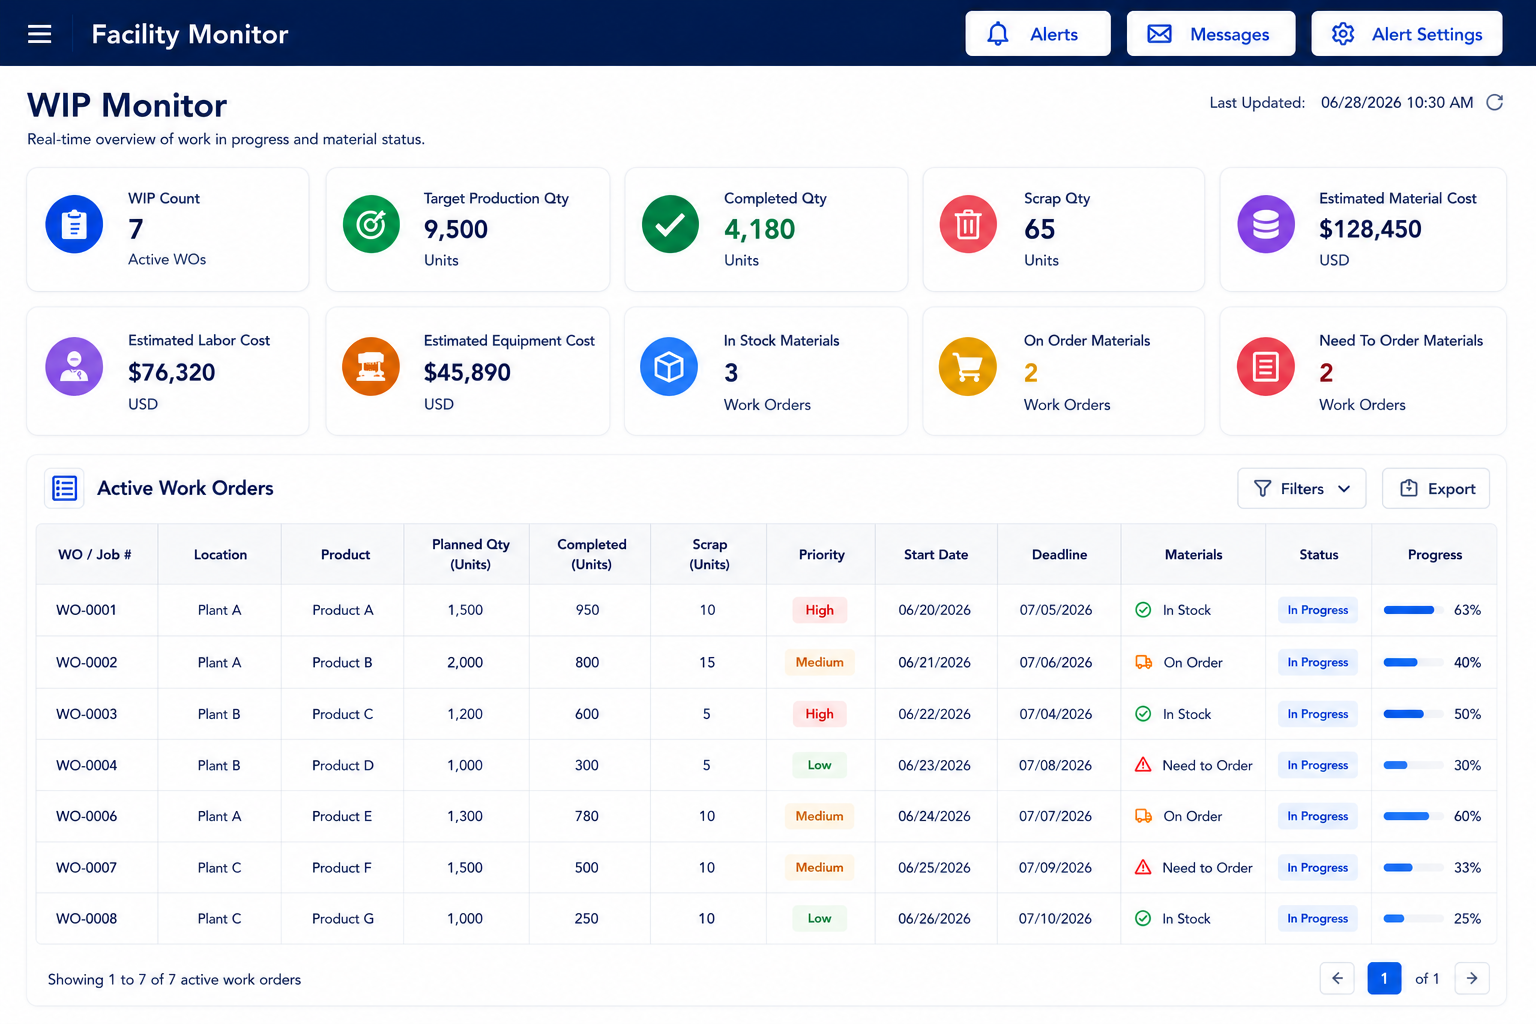
Site KPIs show performance, but WIP shows which work is being affected. WIP Count, Target Production Qty, Completed Qty, Scrap Qty, Estimated Material Cost, Estimated Labor Cost, Estimated Equipment Cost, In Stock Materials, On Order Materials, and Need To Order Materials help teams understand the current state of work in process. WIP is closer to daily execution than total output because it shows which jobs are active, delayed, material-ready, or still waiting on supply. Managers can see whether current problems may affect near-term delivery.
The WIP table brings risk down to specific work orders or jobs. To make the information easier to scan, these fields can be understood in four groups:
Job identity: WO/Job #, Location, and Product show which job is being reviewed, where it is located, and what product it relates to.
Quantity and quality: Planned Qty, Completed, and Scrap show planned output, completed quantity, and quality loss.
Time and priority: Priority, Start Date, Production Time, and Deadline help teams understand urgency, delay risk, and delivery impact.
Execution and material status: Track, Materials, Status, Progress, and Operation show whether the job is in progress, material-ready, delayed, or moving through a specific operation.
With this structure, WIP becomes more than a task list; it becomes a job-level risk view. Managers can quickly see which jobs are affected by site issues and whether production, planning, purchasing, or supervisors need to act. By connecting WIP to Facility Monitor, Industry Software helps teams move from facility-level visibility to job-level action.
Logs and Files Make Facility Issues Reviewable
Logs, Notes, Files, Operations, Resources, and Employees are not supporting details. They are the evidence layer behind facility performance. A drop in OEE may be linked to maintenance notes, operation issues, absence records, material output changes, or field comments. A quality problem may require files, photos, and process records to understand what happened. If these details remain in chat messages, personal drives, or paper forms, later review becomes difficult.
The value of field records grows over time. If an issue is resolved without a record of cause, owner, action, and result, the team may need to investigate from the beginning when the same issue returns. Industry Software keeps logs, notes, and files inside the facility monitoring environment so site problems remain traceable. Over time, this record supports better maintenance planning, downtime reduction, training improvement, and response discipline.
Define the Facility Monitoring Model, Then Validate the Exception Loop
Facility Monitor should not start with a map and a set of tables. It should start with the company’s facility monitoring model. That model needs to define how sites are structured, which zones, assets, employees, and WIP belong to each site, which KPIs represent performance, what counts as an exception, who receives alerts, how causes are categorized, and how response activity is recorded. Without these rules, the system may show data, but teams may still be unsure what requires action. Industry Software helps turn facility management logic into monitoring rules that can support daily response.
A stronger Facility Monitor rollout can follow three stages: define the monitoring model, configure response rules, and validate the exception loop. This approach gives the system a clear data foundation while making alerts, WIP, logs, and responsibility assignment useful for real operations. For multi-site operations, manufacturing plants, and warehouse environments, this is more effective than building a dashboard first because it addresses what should be monitored, who should respond, and how issues should be reviewed. Industry Software can configure Facility Monitor around the company’s site structure, KPI logic, and execution process so it becomes a sustainable operational response platform.
Stage One: Define the Monitoring Model
This stage builds the structure behind Facility Monitor. The company needs to define site master data such as site number, site name, address, location, and operation start date, as well as facility boundaries, map zones, equipment points, and resource locations. KPI definitions should also be aligned at this stage, including OEE, OPE, reject rate, downtime, cycle time, revenue, COGS, profit, and turnover rate. When these definitions are clear, alerts, analysis, and WIP drill-downs are easier to interpret consistently.
Stage Two: Configure Response Rules
After the monitoring model is defined, the system needs rules for operational response. This stage is not only about turning on alerts; it is about configuring alerts, routing, causes, and statuses into usable operating rules:
Alert types and trigger logic: Configure alerts such as operator absence, tooling issue, training required, calibration required, and environmental control failure, with clear thresholds and trigger conditions.
Notification and message routing: Send events to maintenance, quality, production, planning, or management users based on site, role, resource, or event type.
Delay cause library: Standardize causes such as machine malfunction, insufficient labor, material delay, tool unavailability, and quality issue so downtime analysis can be reviewed consistently.
WIP status rules: Define statuses such as delayed, in progress, in stock, on order, and need to order so job risk can be recognized by the system.
These rules determine whether Facility Monitor can move from visibility into response. If alerts have no trigger logic, notifications have no recipient ownership, causes are not standardized, and WIP statuses are unclear, the system can become a static dashboard. Industry Software can help configure these response rules into the operating workflow so exception handling becomes more consistent and traceable.
Stage Three: Validate the Exception Loop
The final stage should test the response process, not just the screen layout. Teams can simulate realistic scenarios such as equipment downtime, operator absence, tool unavailability, material delay, or quality issues to confirm whether the system can move from KPI exception to map location, alert trigger, ownership assignment, log entry, and file record. Role-based views should also be reviewed so executives, supervisors, maintenance teams, quality teams, and planners see information that matches their responsibilities. This confirms that Facility Monitor supports a practical loop of detection, location, response, documentation, and review.
This support is specific to facility operations. Companies do not need only a static map or KPI page; they need a monitoring system that turns facility exceptions into manageable operating work. Industry Software helps organize site information, field records, and response rules into a repeatable process so issues can be detected earlier, assigned faster, and reviewed more effectively. As site count and operational complexity grow, the system can continue expanding KPI, alert, map, and log rules to support more mature multi-site operations.