See the Capacity Value Behind Machines, Tools, and Materials

Summary
×Resource Issues Are Decision Problems, Not Quantity Problems
The real cost of a resource is often not its purchase price. It is what happens when the resource is used at the wrong time, under the wrong load, or with the wrong production risk. A public industry survey from ABB reported that more than two-thirds of industrial businesses experience unplanned outages at least once a month, with the typical business losing close to $125,000 per hour; once resource risk turns into downtime, the impact becomes a cost, delivery, and margin issue, not only a production issue. Many companies do not lack machines, tools, fixtures, materials, or labor resources. The harder problem is knowing which resources create capacity value and which ones quietly consume margin.
One machine may look available in the asset list but remain underloaded in production. Another may look productive because it is assigned to many jobs, while high load, scrap, or maintenance risk quietly turns it into a hidden bottleneck. The more resources a company manages, the more important it becomes to understand not only what exists, but which resources deserve priority, which ones need adjustment, and which ones are starting to affect delivery. Industry Software brings usage, capacity load, cost rates, quality outcomes, and revenue variance into one decision view so resources become operating evidence for scheduling, cost control, and margin improvement.
For production leaders, this visibility is not just another report. It means tomorrow’s schedule can be planned with more confidence, critical machine risks can surface earlier, idle resources can be brought back into productive use, and high-scrap resources are no longer assigned by habit. When resource management works well, the factory becomes more than an order execution center. It becomes a more controllable and improvable engine for capacity and profit.
Find the Resources Production Really Depends On
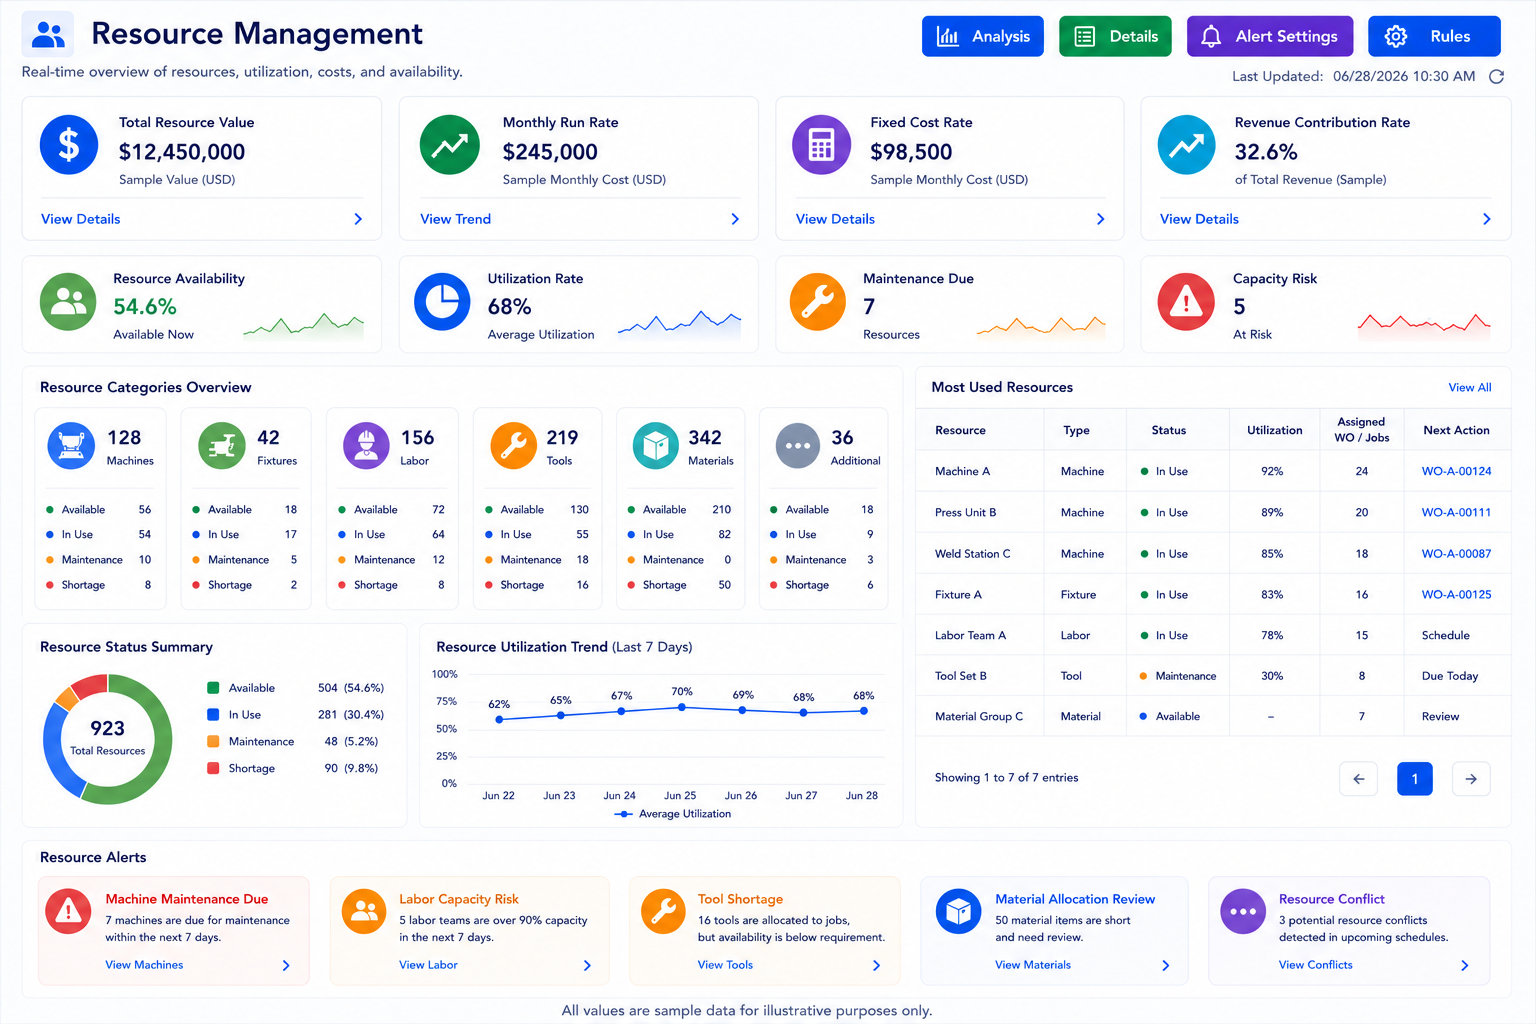
Resource categories are not only a way to organize tabs. They help companies understand what production capacity is actually made of and how different resource types should be managed. Machines often relate to capacity and revenue, tools and fixtures affect setup and execution, materials affect continuity, and labor affects shifts, skills, and time cost. When these resources are mixed into one general list, it becomes harder to know whether a problem belongs to equipment utilization, supply readiness, or labor planning.
Most Used Resources reveals another important layer: dependency. A machine or fixture that appears across many work orders or jobs is not only available; it is critical to execution. If it fails, lacks backup, or creates quality variation, the impact can spread across multiple jobs. Managers need to identify these high-dependency resources before deciding maintenance priority, backup plans, and scheduling strategy.
Resource dependency can be reviewed through:
Usage frequency: Which resources appear across the most work orders or jobs.
Backup availability: Whether high-use resources have alternatives.
Task impact: Whether a resource issue affects one task or downstream operations.
Cost and revenue logic: Whether high-use resources have accurate hourly cost and revenue per hour.
Quality stability: Whether high-use resources also create scrap or low quality percentage.
Rates Are Not Finance Fields Only
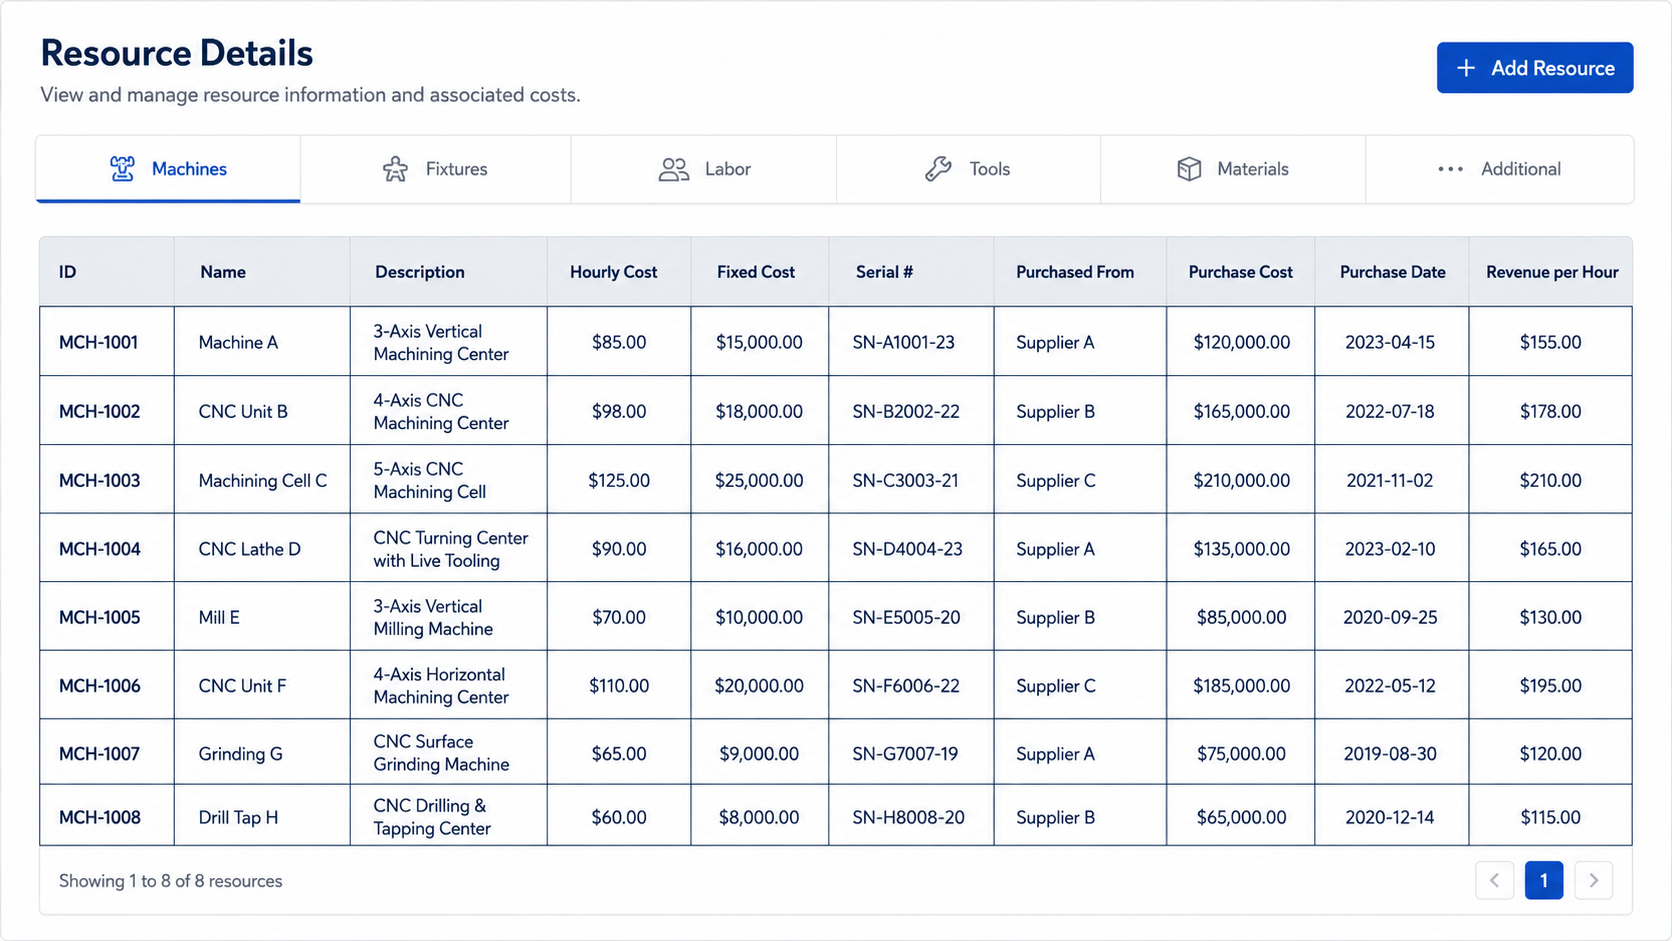
Hourly cost, fixed cost, purchase cost, and revenue per hour are not only finance or asset fields. They influence how resources should be scheduled, how work should be costed, and which assets deserve priority when capacity is available. Two machines may handle similar work, but if one has higher revenue per hour, stronger quality performance, and available load capacity, it should not be treated as a generic option. If another resource is expensive, underused, and unstable in quality, management may need to decide whether it is temporarily idle, overconfigured, or due for a usage review.
Serial number, purchased from, purchase cost, and purchase date also matter. These fields help companies understand resource origin, asset age, and investment context, especially in equipment-intensive environments. Production teams can use this data to understand availability, finance teams can compare cost and investment, and management can decide whether a resource still fits the current operating model. Industry Software keeps these details inside the resource record so production, finance, and management teams can work from the same information.
High-Use Resources Can Become Hidden Bottlenecks
A heavily used resource is important, but it may also be overexposed. A machine assigned to many work orders can become a bottleneck if it has no backup, no maintenance window, or no load-balancing strategy. A fixture or tool used by multiple jobs can create waiting time, changeover delays, and extra coordination. High usage should not only be read as good utilization; it should also be reviewed for operating risk.
Low-use resources deserve attention as well. A machine, tool, or fixture that remains idle may indicate excess capacity, changed demand, outdated rate assumptions, or poor scheduling visibility. A company may appear to have enough resources, while only a small group of assets can actually support critical work. Industry Software helps teams see both sides of the problem: which resources are depended on too heavily and which resources are not contributing enough.
Utilization Only Matters with Capacity Gap
The resources most likely to be misread are often not fully idle or fully overloaded. They are the ones that look acceptable at first glance. A utilization rate of 70% or 80% may appear healthy, but if the gap between supply hours and load hours remains large, available capacity is not being converted into scheduled work. On the other hand, a resource running near saturation may look productive while quietly accumulating maintenance, quality, and delivery risk.
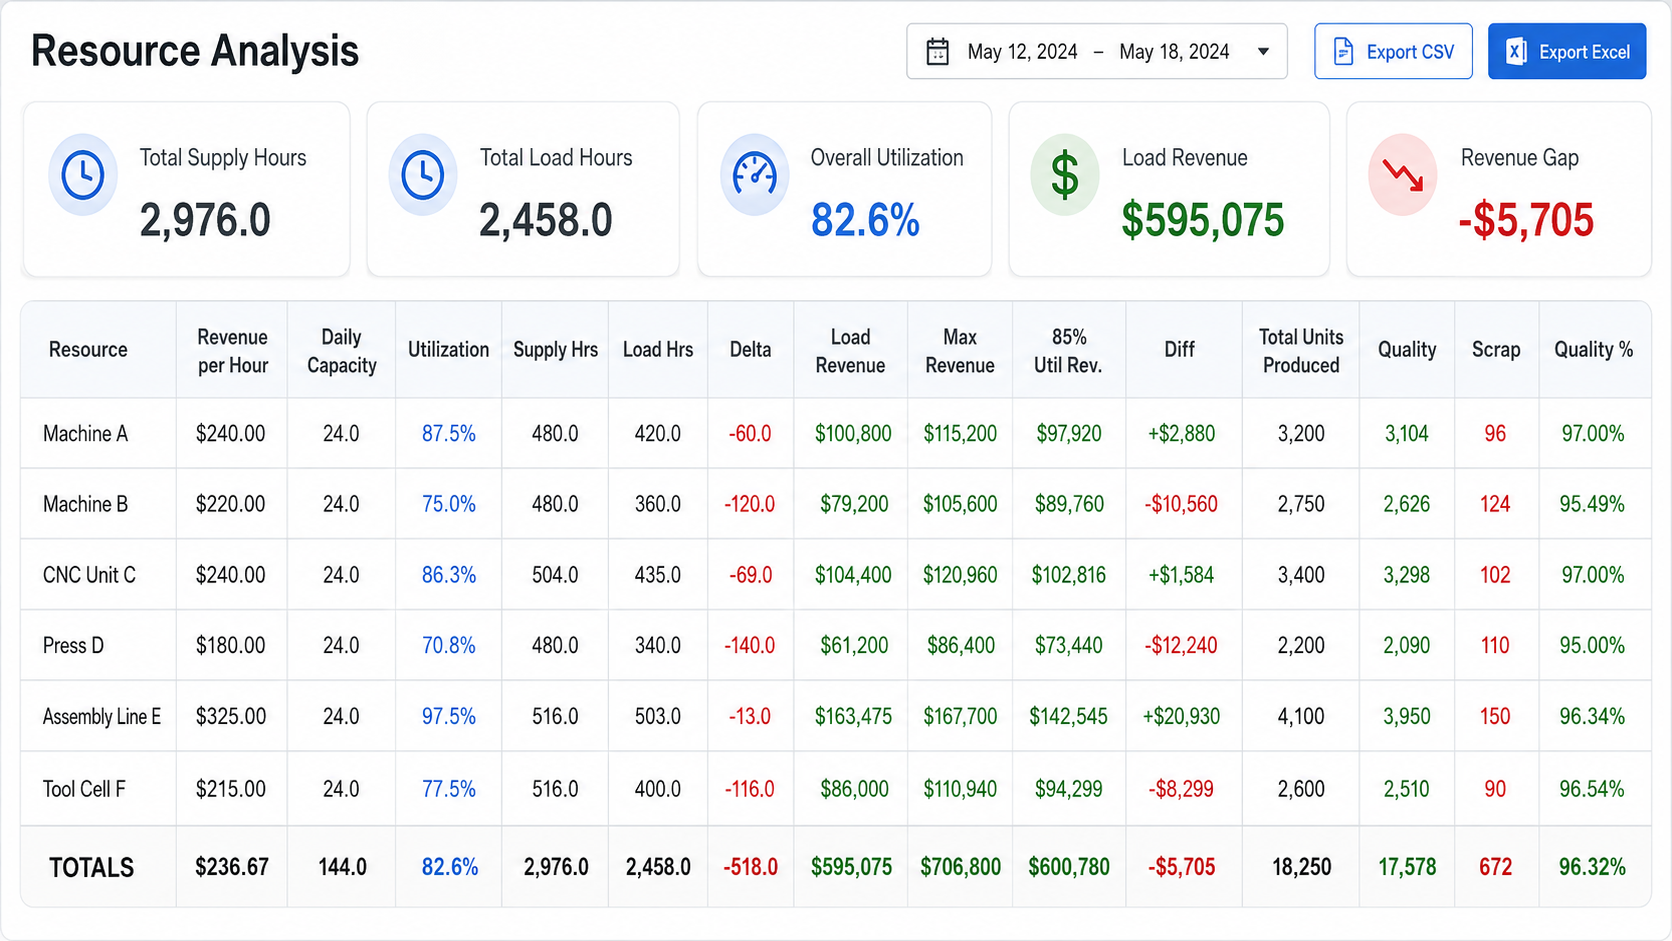
Daily Capacity, Supply Hrs, Load Hrs, and Delta show the relationship between available capacity and scheduled workload. Supply Hrs shows the resource’s available hours in the selected period, Load Hrs shows the hours already assigned to jobs, and Delta exposes the remaining capacity or workload gap. This helps planners decide whether work should be reallocated and helps managers understand whether resource distribution is balanced. Industry Software brings these fields into the Resource Analysis view so utilization issues become easier to identify.
Capacity decisions can use these fields:
Daily Capacity: Baseline capacity the resource can support each day.
Supply Hrs: Available hours during the selected period.
Load Hrs: Hours already assigned to work orders or jobs.
Delta: The gap between available capacity and loaded work.
Utilization: Whether resource use is within the target range.
Revenue Variance Shows Unused Resource Value
Many managers know which machine is busiest, but not always which machine deserves priority. Busy does not always mean valuable, and full load does not always mean strong return. If a high revenue-per-hour resource remains underloaded, the company is not only losing idle time; it is leaving capacity value unused. If lower-value resources absorb too much scheduled work while higher-value resources remain available, the schedule itself may be widening the margin gap.
Load Revenue, Max Revenue, 85% Util Rev., and Diff help companies understand the gap between current workload and possible value. Max Revenue represents the theoretical ceiling, 85% Util Rev. can serve as a more practical target, and Load Revenue shows revenue tied to scheduled work. Diff shows where valuable resources may not be used enough. Industry Software places revenue, capacity, and quality indicators in the same analysis table so resource decisions reflect actual business impact.
Output Is Not Enough Without Quality
High output does not always mean strong resource performance. Total Units Produce, Quality, Scrap, and Quality % help teams understand whether a resource produces reliable results. A machine may be busy and produce a large number of units, but high scrap can cancel out much of that contribution. High load combined with high scrap is not efficiency; it is an operating risk.
Quality data also helps teams find the source of problems. If one resource consistently shows a lower quality percentage, equipment condition, tool accuracy, operating standards, or maintenance rhythm may need review. If multiple resources create scrap on the same product or operation, the cause may be material, process, or inspection rules. Industry Software places quality outcomes beside resource performance so teams can judge not only what was used, but what produced acceptable results.
Rules Should Turn Resource Risk into Action
Rules and Alert Settings should not create more notifications for the sake of activity. Their value is to move resource risk into the right workflow earlier. Resource problems usually do not appear all at once. They often start as rising load, increasing scrap, growing revenue variance, repeated use of a critical tool, or underuse of a high-value machine. If these signals stay inside analysis tables, teams may not act until schedules slip, costs rise, or quality issues expand.
For example, if a CNC machine stays above 90% utilization for three consecutive days while scrap rate rises above 3%, that should not remain a red number on a dashboard. The system can notify the production supervisor and maintenance engineer, request a maintenance check, review process conditions, and evaluate whether work should be reallocated. If a high revenue-per-hour resource remains below 60% utilization, planners may need to understand why valuable capacity is not being used. This is how rules turn resource visibility into operating discipline.
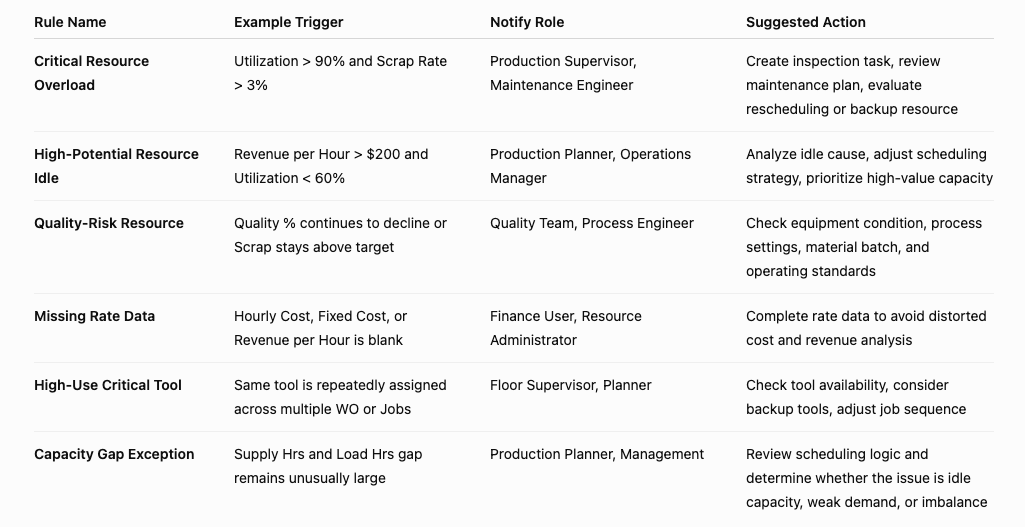
The goal is not to replace management judgment. The goal is to surface the right issues earlier and route them to the right people. Industry Software can configure rules around the company’s resource structure, cost logic, and scheduling process so different exceptions follow different paths. Equipment issues can move into maintenance, quality issues into QA or process review, missing rate data into finance cleanup, and capacity gaps into planning review. Resource analysis then becomes a repeatable operating workflow, not just a reporting view.
Go-Live Starts with Resource Logic and Modular Rollout
Resource Management implementation should not begin by simply loading machines, tools, materials, and labor into the system. The first priority is to align how resources should be calculated and interpreted. Companies need to define resource categories, required fields, rate sources, daily capacity rules, how supply hours and load hours are calculated, and how quality, scrap, and total units produced are tied back to resources. Without this logic, the system may contain a complete resource list but produce analysis that production, finance, and management cannot interpret in the same way.
A stronger rollout does not need to place every resource category online at once. Companies can start with the resources that most affect production plans and cost decisions, such as heavily used machines, fixtures, tools, or materials. Then the team can configure hourly cost, fixed cost, revenue per hour, daily capacity, utilization, 85% utilization revenue, and revenue diff using real operating data. This staged approach reduces early data pressure while helping teams validate value through actual work orders and jobs.
Industry Software’s product and service value for Resource Management rollout includes:
Cloud-based usage: Supports multi-site access to resource data, analysis results, and reports without complex local deployment.
Modular rollout: Starts with key resource categories, then expands toward a complete resource structure.
Fast deployment: Prioritizes master data, rates, capacity, utilization, and revenue variance so core analysis can run earlier.
Role-based training: Provides practical guidance for production, planning, finance, quality, maintenance, and management users.
Ongoing support: Helps adjust rules, data definitions, reports, and module scope after go-live.
Process-fit configuration: Configures the system around the company’s resource structure, scheduling method, and cost logic.
During rollout, Industry Software can help teams define:
Resource category rules: Which objects belong to machines, fixtures, tools, materials, labor, or additional resources.
Rate sources: How hourly cost, fixed cost, purchase cost, and revenue per hour should be maintained.
Capacity calculations: How daily capacity, supply hours, load hours, delta, and utilization should be calculated.
Quality mapping: How total units produced, quality, scrap, and quality percentage connect to resource performance.
Revenue analysis targets: How Max Revenue, 85% Util Rev., and Diff should support management decisions.
Rule triggers: When utilization, scrap, missing rates, capacity gaps, or high usage should trigger alerts.
Role ownership: Which resource issues belong to production, planning, quality, maintenance, finance, or management.
This rollout approach turns Resource Management into an explainable and expandable resource analysis tool. Through cloud-based usage, modular rollout, fast deployment, role-based training, and ongoing support, Industry Software helps resource data support production planning, cost control, and management decisions sooner. As resource categories, order structures, and production methods change, the system can continue adapting analysis logic and rule conditions to stay close to real operations.