Others List Resources, We Calculate Profits

Summary
×Most resource tools tell you what you have. This one tells you what you earn.
Total Picture, No Guessing
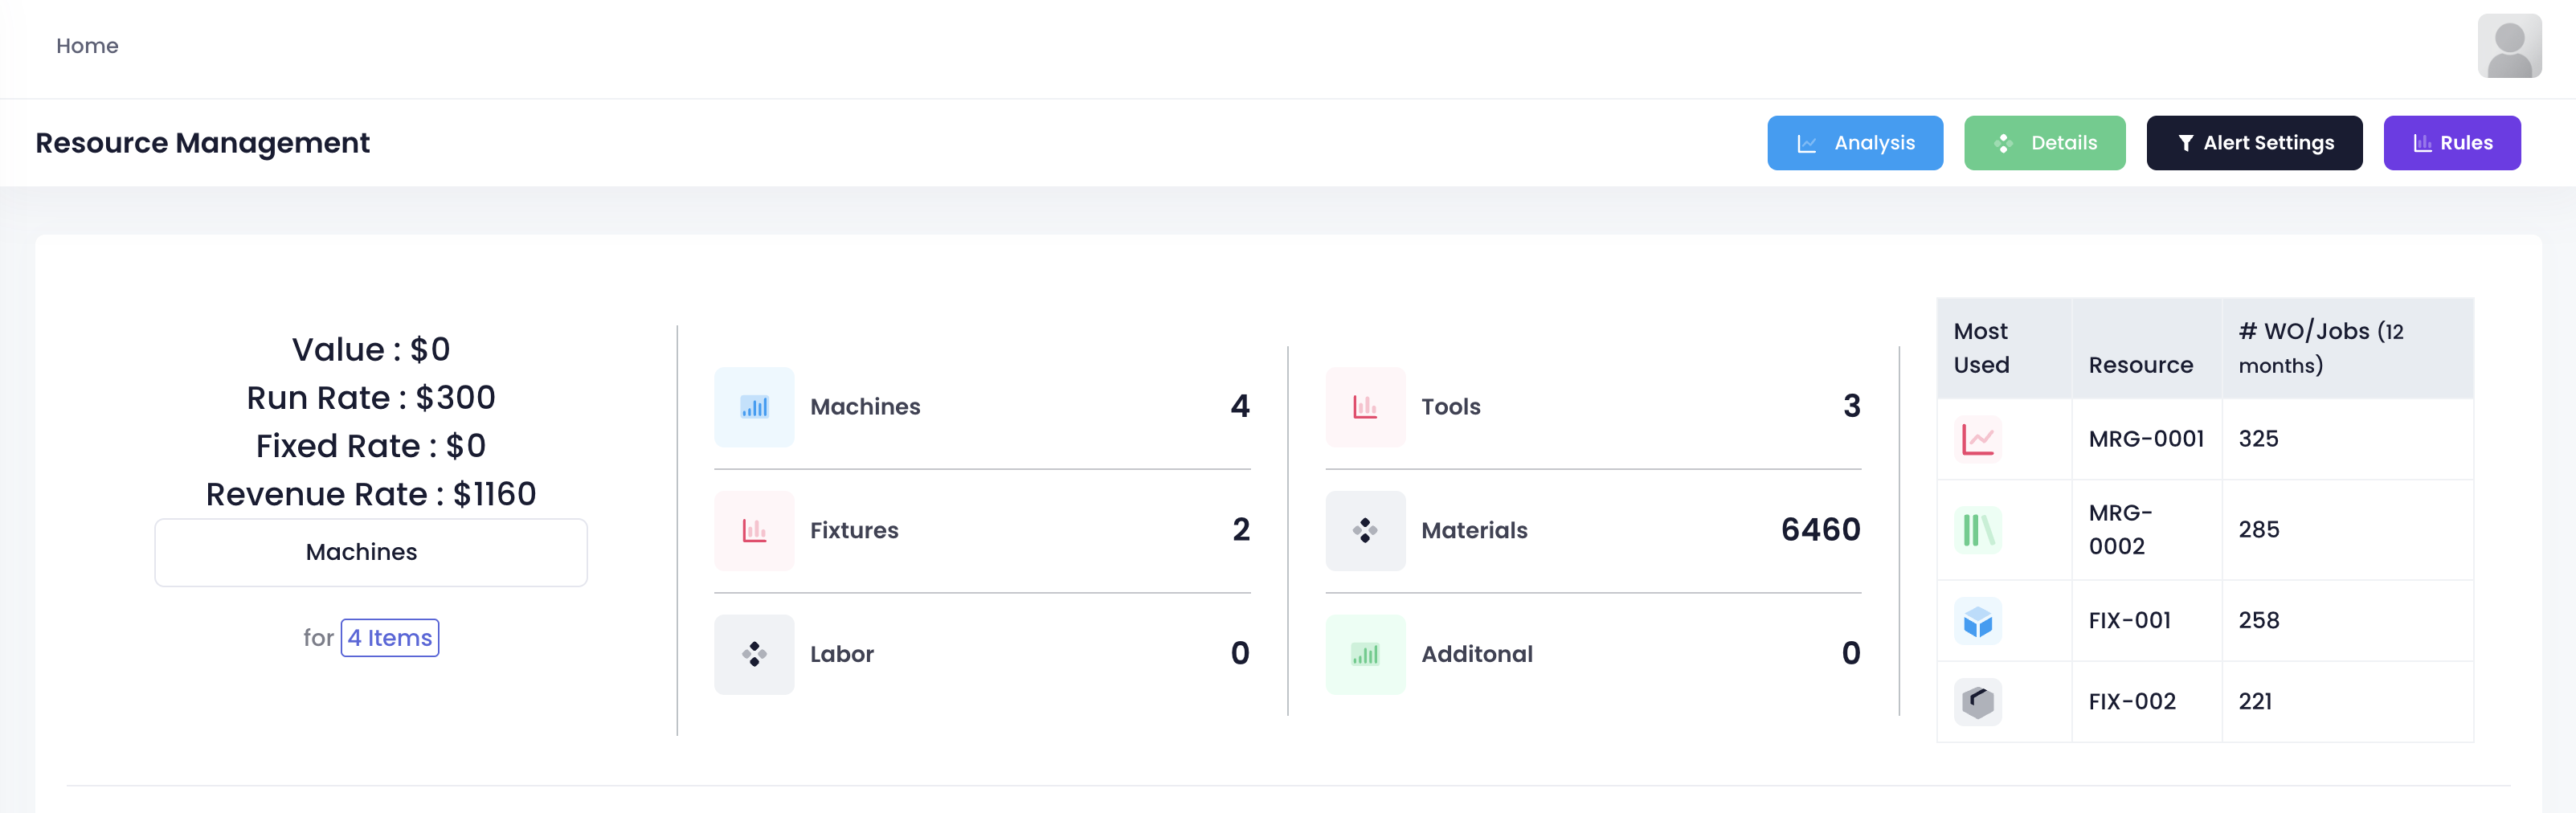
Open the page. The top row sets the tone. Value, run rate, fixed rate, hourly revenue.
Every Resource Has a Ledger
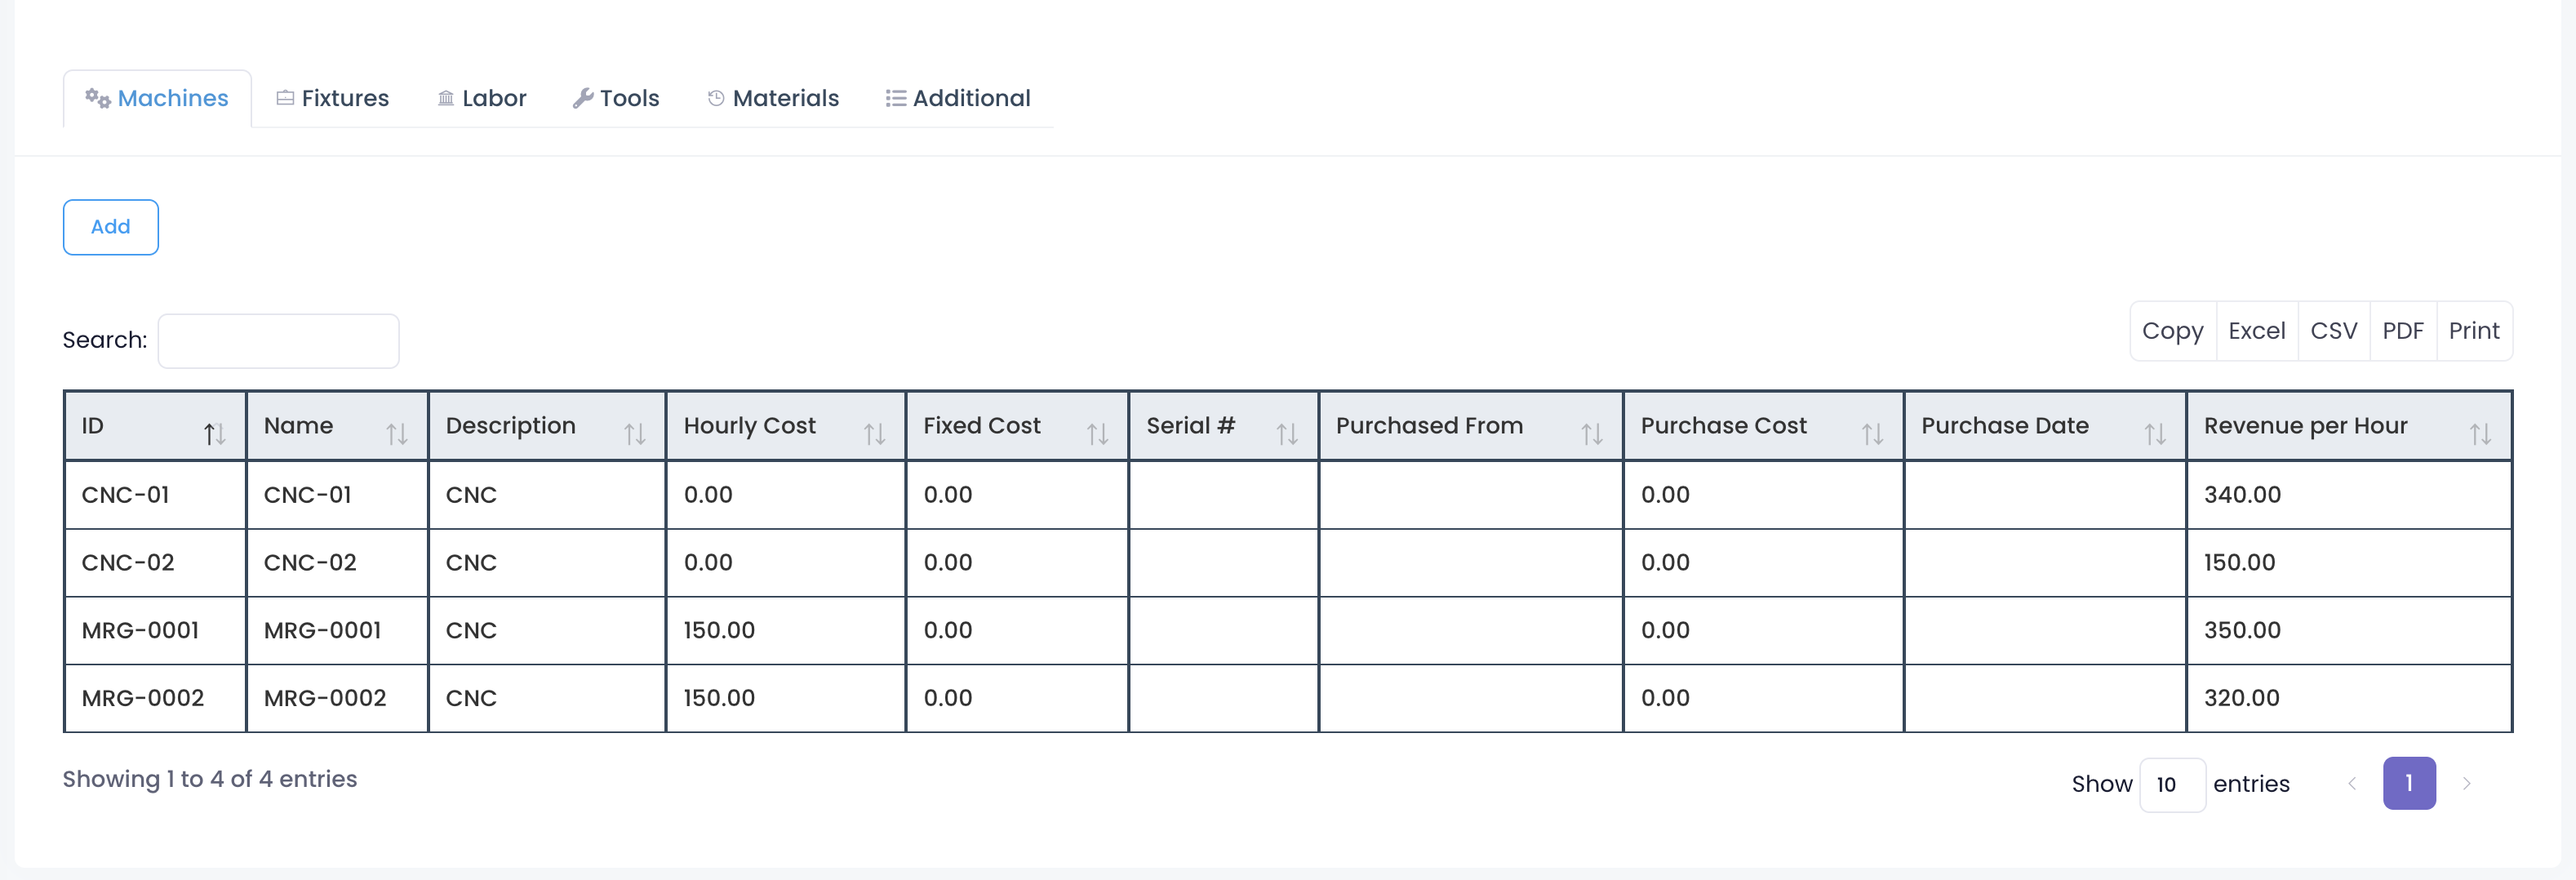
Click into any resource type, and the full profile opens.
Take machines, for example. Four CNCs lined up: CNC01, CNC02, MRG0001, MRG0002.
Utilization, Revenue, Scrap, One Row
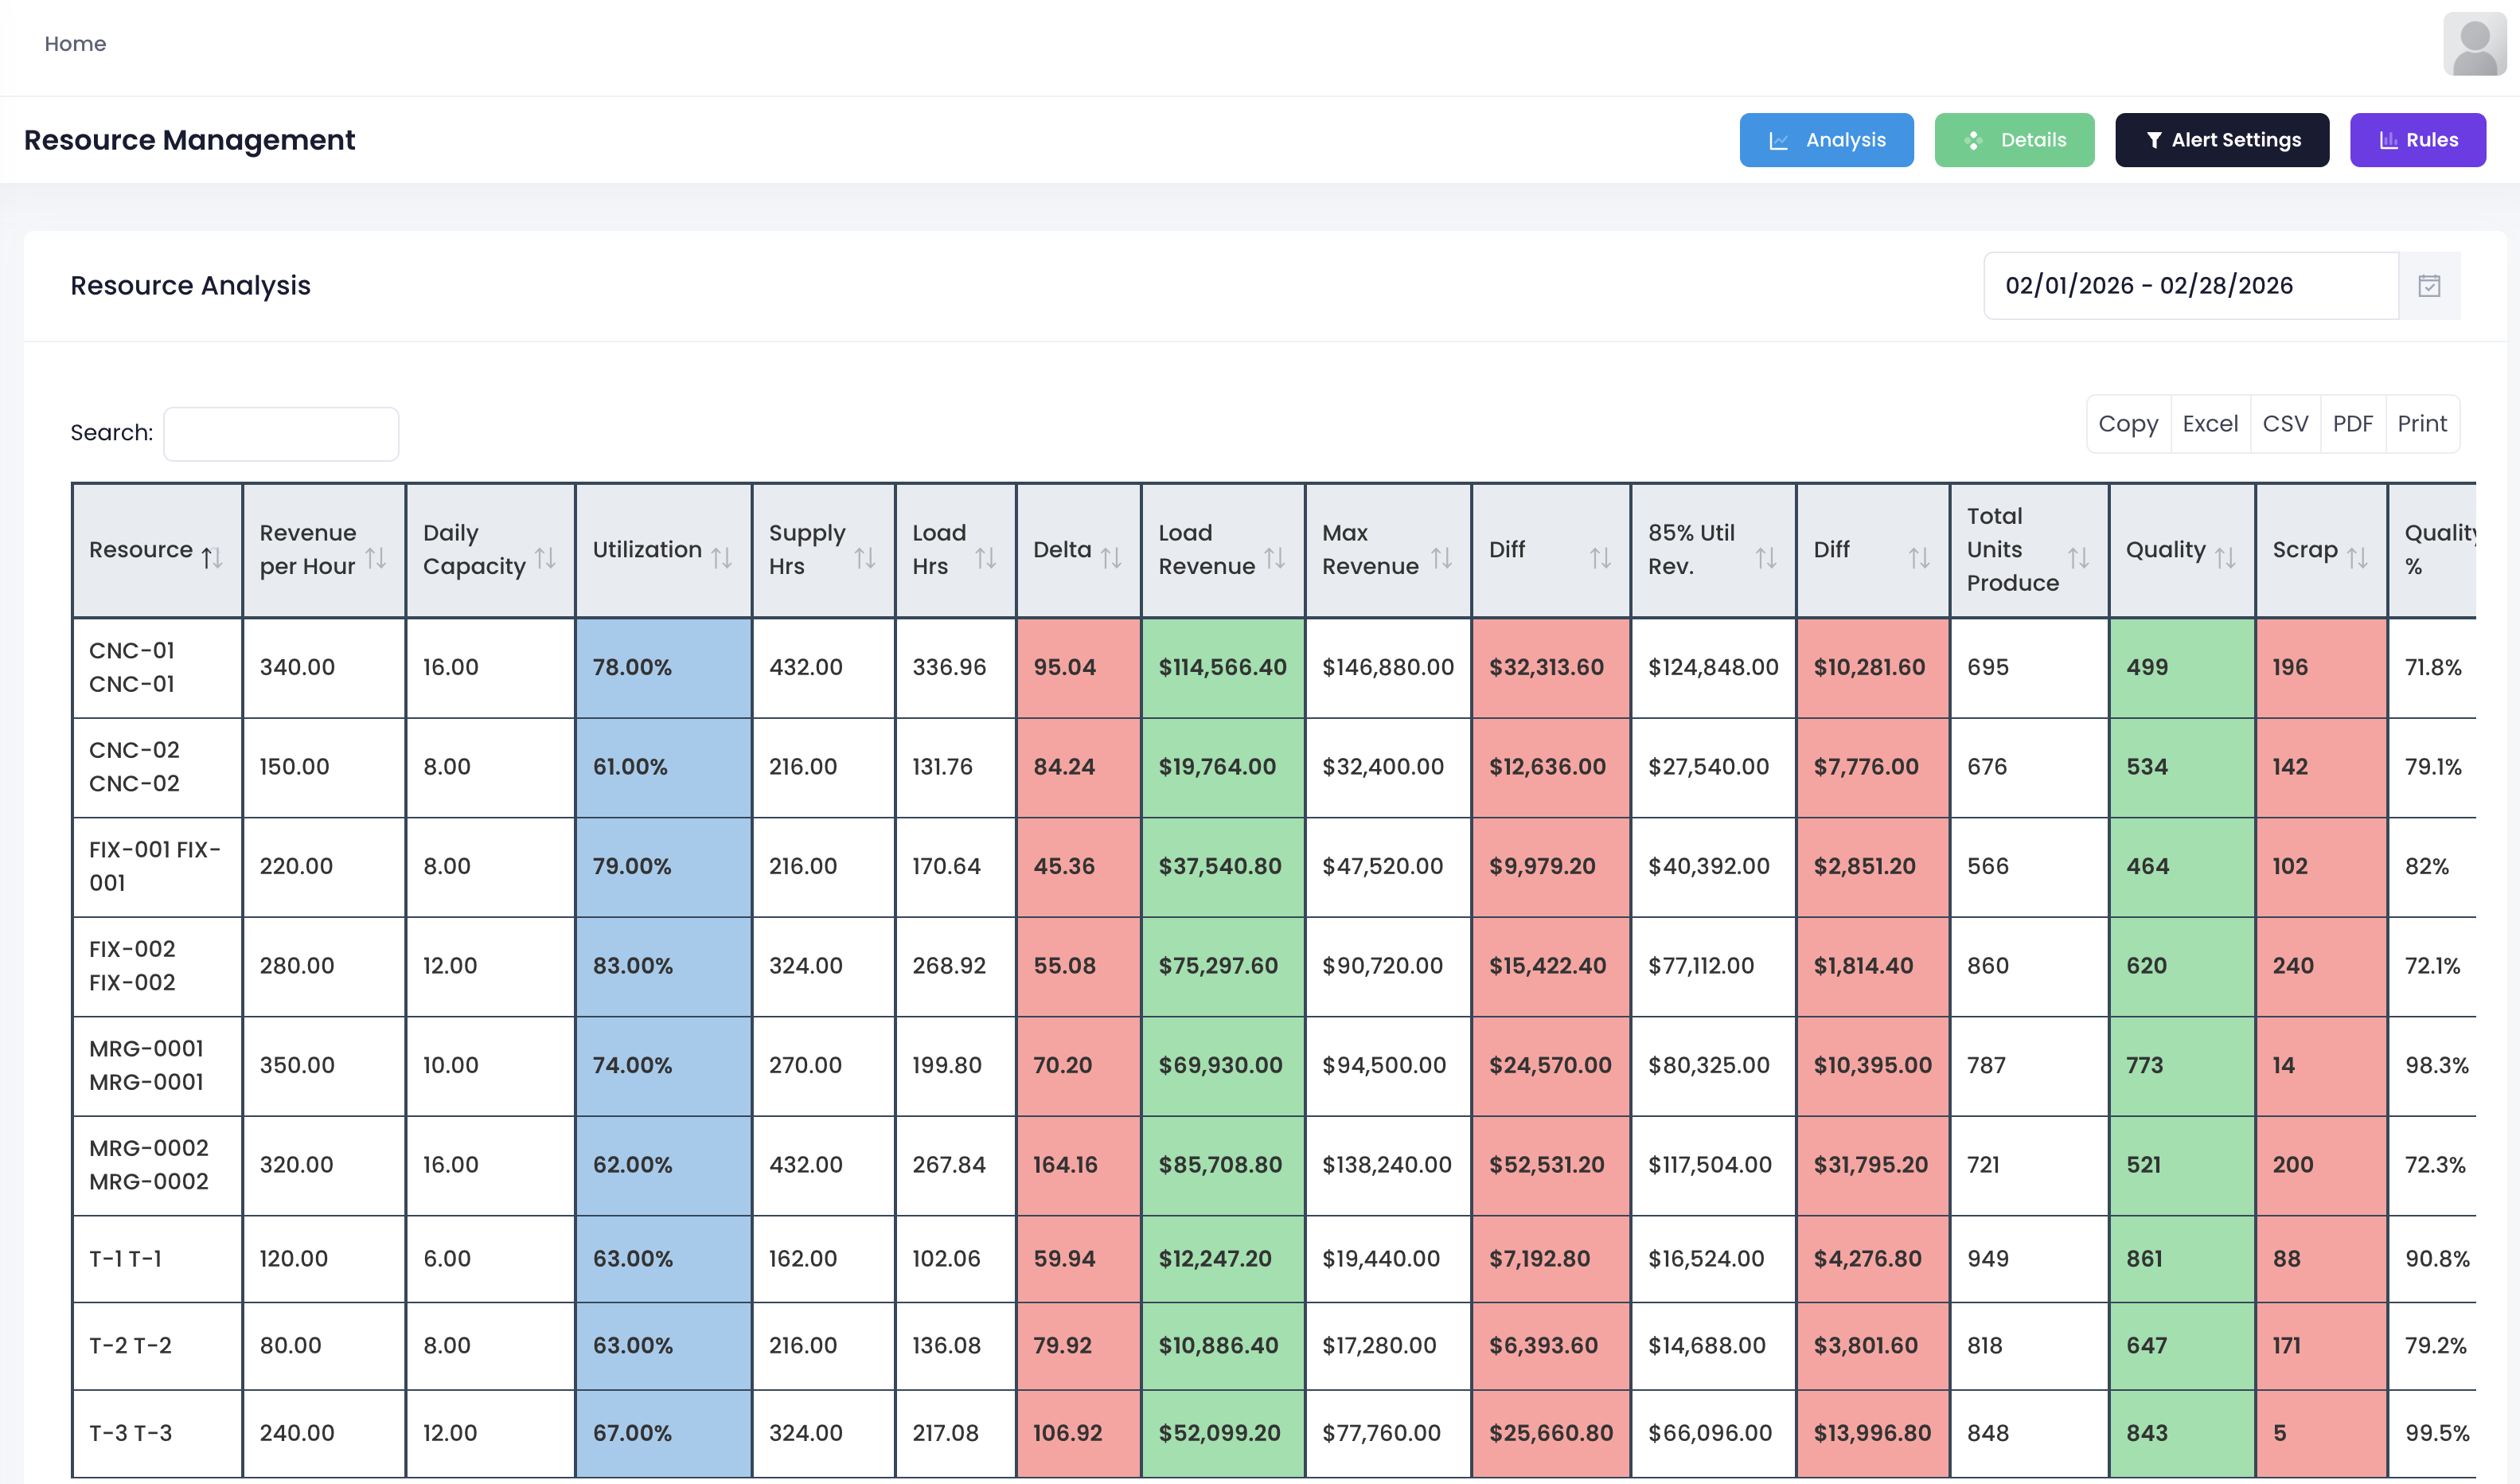
This is the resource analysis page. One month of data, all here in one place.
CNC01 utilization 78 percent. Hourly revenue 340. Supply hours 432. How many used, how many left. One row. FIX001 utilization 83 percent. Hourly revenue 220. Supply hours 162. Used 136. Left 79.92.
Actual revenue, max revenue, gap, revenue at 85 percent utilization. All calculated. CNC01 actual revenue 75K. Max potential 90K. Hidden room for 15K more. Which machine still has capacity, which resource needs more work. The numbers tell you directly.
The last columns show total units, quality rate, and scrap rate. CNC01 produced 860 units, quality rate 72 percent, 240 scrapped. Which part of the process has issues? Follow the numbers.
Resource Management Is Not Inventory. It Is Profitability.
Most people manage resources by remembering locations and counting quantities. Where is this machine? Who borrowed that tool? It all relies on memory.
This system turns every machine and every tool into numbers. How much earned per hour. How many hours used this month. How much capacity left. Quality of output. No guessing who is busy or who is idle. No calculating which one earns more. Open the screen. Every resource shows what it earns, what it costs, and how long it sits idle.
Who is working, who is waiting, who needs more work. One look and you decide.